I’ve recently been looking back on what we have written about our architecture in the past, and came to a stunning realization. That realization is that while we have many many different articles about what we have been doing there hasn’t been a good, solid overview of our architecture in a long time. In fact, the last really comprehensive write-up was done by Jeff before this blog even existed. And, boy I do have to say there has been quite a lot of change behind the scenes since then. So, my dear readers I’m going to take some time – and my next few blog posts – to give everyone an in depth look into how we have the Stack Exchange Network setup to serve between 12 and 14 Million page views per day.
How these posts will breakdown
Since we have obviously grown, and are offering more services to our users I’m going to break these posts out by each of the 4 major services we offer to our user base:
- Core Q&A (this includes the API)
- Careers
- Chat
- Community Blogs
Each one of these systems all work towards our goal of making the internet better, but they have different requirements and different challenges.
In this first post, I’ll be focusing on our core Q&A system, since that is after all our bread and butter.
Core Q&A
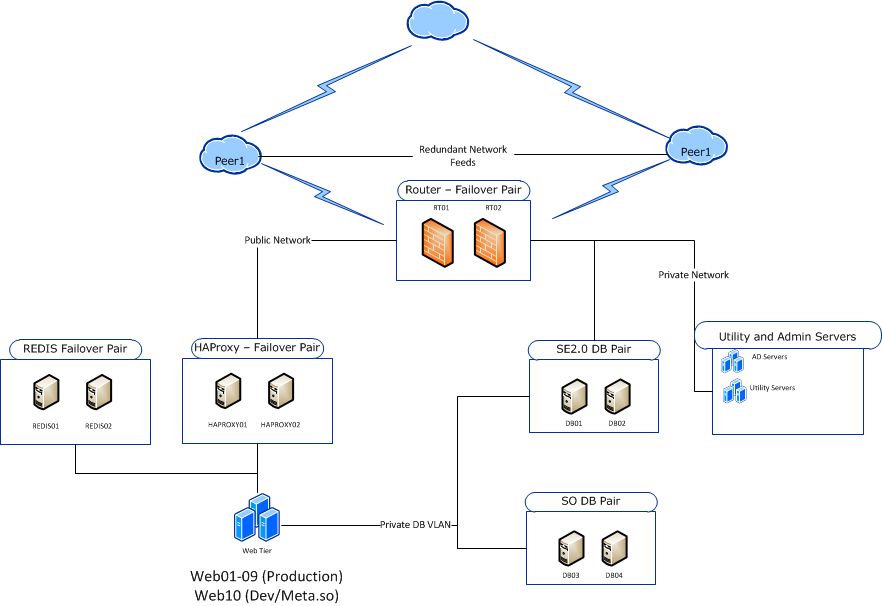
First, a high level overview of how everything is put together:
The Hardware
Our core hardware setup hasn’t changed all that much. Well, I should say the chassis haven’t changed that much. We’ve done a lot of work to upgrade the internals of the servers when needed to address performance issues as they came up, as well as handle issues that resulted from Stack Overflow being so big.
Web Tier
Of these 10 Servers, 3 are dedicated to Stack Overflow with an additional 3 servers serving Stack Overflow and the Stack Exchange Network. We have one server dedicated to Dev/QA – which also hosts meta.stackoverflow.com. Our Web Tier machines normally operate between 5 and 20% utilization. We have plenty of room to grow on these boxes.
- 10 Dell R610 IIS web servers:
- 2x Intel Xeon Processor E5640 @ 2.66 GHz Quad Core with 8 threads
- 16 GB RAM
- Windows Server 2008 R2
- 2 drives
- RAID 1
- 2x Intel 320 300GB SSD (RAID 1)
DB Tier
We have two database server pairs. One pair is dedicated to running Stack Overflow, and the other runs the rest of the network. We run development against the secondary server of the non-stack overflow database pair. Both of our database pairs run at about 20% utilization, so once again we have room to grow here as well.
- 2 Dell R710 database servers:
- 2x Intel Xeon Processor X5680 @ 3.33 GHz
- 96 GB RAM
- 8 spindles
- Mirrored Pair for OS
- 6 disk RAID10 for databases
- SQL Server 2008 R2 SP1
- 2 Dell R710 database servers (Stack Overflow Dedicated):
- 2x Intel Xeon Processor X5680 @ 3.33 GHz
- 96 GB RAM
- 8 drives
- Mirrored Pair for OS
- 6 drive RAID10 of Intel X25-E SSDs for Database
- SQL Server 2008 R2 SP1
Caching Tier
We run redundant Redis servers for our caching tier.
- 2 Dell R610 Redis servers:
- 2x Intel Xeon Processor E5640 @ 2.66 GHz
- 16 GB RAM
- CentOS
Network Layer
We use HAProxy for our load balancing, and Cisco Switching.
- 2 Dell R610 HAProxy servers:
- 1x Intel Xeon Processor E5640 @ 2.66 GHz
- 4 GB RAM
- Ubuntu Server
- 6 WS-C2960S-48TS-L Gigabit switches
- FlexStack (two stacks, 4 switches and 2 switches)
Data Integrity
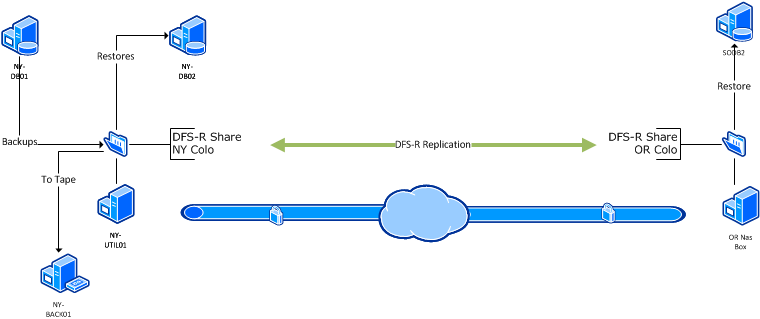
As with any system, making sure that your data is backed up and the backups are good is an integral part to your service offering. We backup our databases nightly and restore them to two different locations. One local to our NY data center for our devs to work against, and one remote in our OR data center.
Conclusion
Overall I believe that we are in a good place and have plenty of room to grow given our current setup. As always we will constantly be looking at our infrastructure and tweaking it to get the best performance possible and give our users the best experience possible.
The Three Perspectives
In this three part series I am going to explain a three level framework for monitoring your infrastructure. As an overview, the three levels are:
- Micro: “Ground Level”
- Meso: “Day to Day”
- Macro: “Seasonal”
These levels go from a detailed close up view of your environment to a large-scale view. “Ground Level” monitoring is a highly detailed, micro view of your environment. The “Day to Day” view is an ongoing picture of your entire environment. Lastly, what I call “Seasonal” monitoring is a macro perspective of how your environment changes over months or years.
From my experiences with system administrators, anecdotally I would say that most are only doing the meso level with maybe a touch of the micro when problems happen. The meso level is common because this is what tools like Cacti and Nagios handle. This sort of monitoring system is fundamental to day to day operations. However, the other levels are just important for a high performing environment.
I am breaking this into three levels because each level is handled differently and has different characteristics. Because of the different attributes of these levels there are also different tools suited for each type of Monitoring.
Ground Level Monitoring
“Ground Level” or micro monitoring is high resolution monitoring. By this I mean that you take a lot of samples in short periods of time — generally every second or multiple times a second. These tools are often run from the machines themselves. They also return lots of information. You are probably already familiar with many tools you would use for micro monitoring:
- Perfmon
- Sar
- Wireshark / TCPDump
- Web Logs (or other detailed logs)
- SQL Server Profiler
However, system administrators generally think of these tools as troubleshooting tools and not monitoring tools. The difference is that monitoring is run regularly and is a process for discovering problems. Troubleshooting tools on the other hand are manually run by the administrator as a reaction to a problem.
In order to start having a ground level view, these tools need to be deployed for monitoring purposes, not just troubleshooting. In order to do this these tools should be scheduled to collect data for a period each day. They should all run at the same time so you can correlate the data. Then the data needs to be analyzed, and the relationships between different sources on a regular basis.
The Attributes of Micro Data
The most distinct attribute of ground level data is that there is a lot of it. This attribute has several consequences for this type of monitoring:
- Different sets of tools to process the data are needed
- Generally samples of high resolution data and not complete sets are used
- To correlate all of this, you will need to do some work because it will be different for every environment
Since you are working with samples to make the data size manageable it is good to think about what your samples represent. They might not show things that happen say every hour if you have a 20 minute sample. If you are choosing a set or single server from a farm, you might miss issues that are particular to one server. However, mid-level monitoring like Nagios are usually good for finding these problems. Also, if you choose your samples well you can likely discover things your standard monitoring systems miss.
One other thing to keep in mind is that collecting high resolution data can be resource intensive, so it is possible that the act of monitoring effects the system itself (And no, I am not going to cite a certain physics principle).
Case Study: Web Logs and Perfmon Data
Data Analysis Platforms
Having a platform to work with for data analysis is essential for high resolution data. I have been learning R and using RStudio as my data analysis platform for a week now. I believe this is going to be my standard tool for analysis. R is a domain specific language focused on statistical analysis. Platforms such pysci and R are going to become part of the standard toolkit for system administrators because they allow you to view your data in different ways (i.e. distributions) and provide a lot of functionality to combine different data sources. They are also naturally more programmatic then something like excel.
Getting the Data
For windows the standard tool to get a high resolution picture of the system is Perfmon. With “Data Collector Sets” you can give a list of counters to monitor and save to a perfmon binary file (.blg) or other formats. I used this to collect data from 20 minutes on one of my web servers. We also insert our web logs into SQL Server. Both of these allow me to easily extract CSV files which can be imported into R. Since the web logs are in SQL, it is easy to filter on time and requests that only went through the web server I was monitoring with perfmon.
Exploring the Data with R
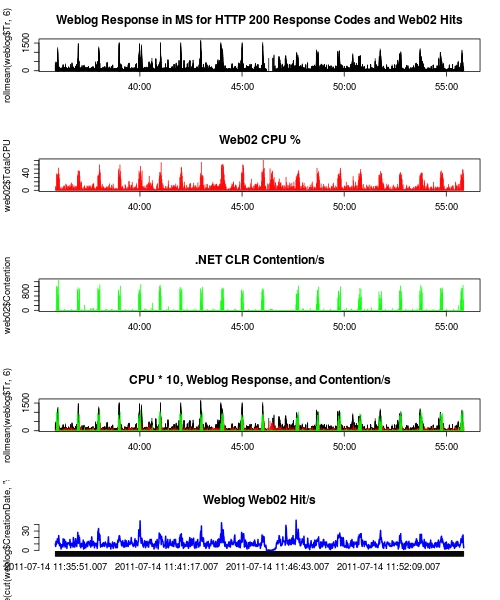
I have a feeling as I get to know R better I will discover more advanced ways to mine the data for things I am interested in. For now, plotting things like CPU and response time of web requests lets me visually find correlations without too much difficulty. After starting with CPU and web response time, I noticed that there was a correlation. Digging into this more, I found that response time for several requests will go up to over a second when the CPU spikes to around 60%. This also correlates with .NET lock contention as well (Larger Image, R Script):
Our SQL logging is currently losing entries, but there is enough data to see the correlation. I suspect with a full weblog data set the correlation will be even stronger. I have yet to find out the cause of these slowdowns that seem to happen about every minute, and am going to enlist some developers to get to the bottom of it (“Correlation does not imply causation”). I should point out that I checked another sample of weblog data when perfmon was not running to make sure the response time spikes were not a result of the monitoring itself.
The Difference?
If we looked at the CPU from something like Nagios it is going to look quite low (20%). This problem is unlikely to show up when using a profiler unless you just happen to load the page during these slow downs. High resolution monitoring allows you to discover issues like this that get buried with low sample rates. Also having a platform to view multiple data sources allows for the discovery of correlated metrics.
What is Next?
I don’t have a high resolution system deployed yet. So I need work on and think about:
- Scheduling Perfmon
- How to get the most representative samples
- Scheduling TCPDump and getting that data into R
- Scheduling Sar on the Linux boxes and getting that into R
- Automating parts of the analysis
I also need to discover more efficient ways to discover correlations and patterns in R with the data I am collecting. In short, the need for high resolution monitoring is becoming evident to me and there is a decent amount of work to get this deployed. As I explore this domain of monitoring I will get to know the caveats and develop systems for doing it more effectively.
In the next post I will talk a little about “Day to Day” monitoring with systems like Nagios, and how this data compares to higher resolution data in attributes and functionality.
Per Second Measurements Don’t Cut It
Kyle Brandt
Transfer rates and the number of packets you send are measured in units of a certain quantity of data per units of time. The unit of time that everyone is used to is the second. The standard quantity of data that is used in the networking field is bits and the standard time unit is seconds. So for example, the standard network interface these days is 1 Gigabit per second. So the quantity of data is a Gigabit, and the unit of time is a second. We call this the transfer rate. The key thing to remember is that this is a fixed ratio of data over time. Because of this, you can divide the ratio by any number you want to (Ignoring the complexities of the discrete properties of Ethernet frequencies, system clocking, etc). So, 500 Mbit over a half second is the same fixed ratio as 1 Gigabit per second.
The thing is though, in computing, a second is a really, really, really long time. This is important, because when we choose what unit of time to express this in, what we are doing is graph smoothing (It is sort of, although not really, like taking an average).
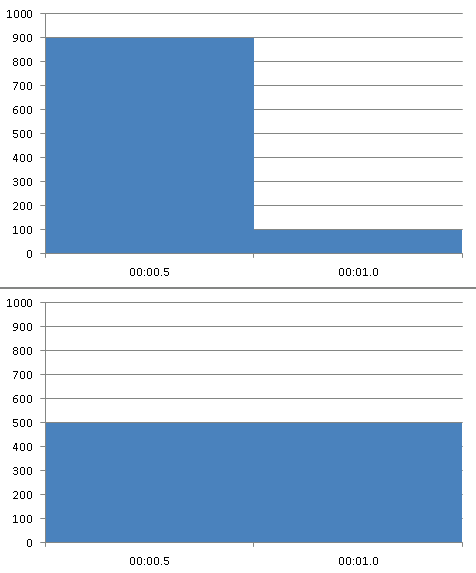
For example, we could transfer 900 Mbit in half of a second and another 100 Mbit for the other half of that second. How much data was transferred during that second? The answer is 1 Gbit. If we transfer 500 Mbit per half second and another 500 Mbit per the other half second — this is also 1 Gbit per second:. This effect is illustrated in these Megabits per half second graphs:
These two are clearly not the same thing, but when you express them as the amount of data transfered over a second they are. This is important because a 1 Gbit per second interface is also a 500 Mbit per half second interface — and a 500 Mbit per half second interface can’t transfer 900 Mbits per half second (I am ignoring any buffering effects, but in practice we have found this to be essentially true).
This effect is made even worse by most monitoring tools because most take samples every 5 minutes. So what you are really seeing is the transfer rate per 5 minutes converted to a per second rate. This sort of thing is why people say data can lie.
Why Should you Care?
We discovered that we were discarding packets pretty frequently on 1 Gbit/s interfaces at rates of only 10-30 MBit/s which hurts our performance. This is because that 10-30 MBit/s rate is really the number of bits transfered per 5 minutes converted to a one second rate. When we dug in closer with Wireshark and used one millisecond IO graphing, we saw we would frequently burst the 1 Mbit per millisecond rate of the so called 1 Gbit/s interfaces.
We have bonded these interfaces using Intel Load Balancing (ALB/RLB) and for the most part our discards have gone away. We did this on all but one of our web servers for a while and found that the one that didn’t have the bonded interface had discards climbing while the others did not.
A second is a long time — be wary of trusting it too much to measure things.
Have You Tried Turning it Off and On Again?
Kyle Brandt
When you have an infrastructure problem, rebooting the machine(s) is something you should do as a last resort. The reason is that you likely will never learn what the problem was, and it is probably going to come up again. I generally deplore this sort of troubleshooting and wrote about that opinion in my previous “Push the Green Button Twice” post. That being said, this is what we resorted to this past Friday for our entire switching infrastructure. This brought us offline for several minutes.
It all started on a Rainy Evening this Past Wednesday…
On Wednesday evening of this past week we started to see network timeouts in our application logs. Digging into this further and checking more logs this seemed to be widespread. On our Linux routers which run carp on the LAN side we saw some flapping going on. On our load balancers, we saw messages about late heartbeat messages. We use failover Intel teaming on our web server NICs and saw errors about missing probes. The problem was wide spread enough that it seemed to be the switching infrastructure, however there were no significant errors in the switch logs. We did see some ASIC and interface drops, but the incrementing of these did not seem to always coincide with major network blips in our infrastructure.
We then tried to localize the problem. We took network captures, and lots of them. Some from SPAN ports covering all of our traffic. Some from examples between select servers from the viewpoint of both servers as well as the viewpoint of the switch ports they were attached to. In addition to this we did iperf tests and ping tests between all sorts of different points in our network. We did broadcast analysis, tcp analysis, latency analysis, and IO graphing. Several of us worked pretty much around the clock for three days trying to figure this out. Although from the outside we were pretty much up, users were seeing timeouts. We even brought Cisco support into the mix and went through 3 support techs.
After three days of this, we honestly didn’t know a whole lot more than we did when we started — we were losing packets. We thought a lot about what we changed when this all started to happen and couldn’t think of anything. About two weeks ago we changed our switch configuration to a stacked setup using flexstack. Although a major change, it was two weeks ago. When we start to go down this road we are just starting to guess. Unless you actually see evidence that points to something, you really could say it is just about anything. The switch stacking is more related to what is going on, but there have been more recent changes — like the fact that it was raining — perhaps it was the rain?
When the jokes about what might be causing the problem become just as frequent as reasonable theories, that is probably the time to just try turning it off and on again — and that is what we did. It seems to have fixed the problem, but the weekend is our low traffic point and it could just seem fine because of that. This could also be some sort time based bug or something that is only triggered under a certain conditions.
Our Best Current Theory
Although traffic on most of our interfaces is quite low, lower than 100Mbit/s on Gigabit ports, it occured to me that maybe we were saturating more small scale units of time. I posted a question about this on Server Fault. The basic idea is that 1GBit per second is also 1Mbit per millisecond, and we are spiking the one millisecond limt frequently. If that is a realistic limit, our captures confirm that we do hit a lot. Perhaps enough of these spikes punishes the switches enough to trigger an unknown IOS bug?
This is still just a guess, but it is at least a plausible theory. So the solution we are going implement is a network architecture change I had planned on if we ever approached the 1 GBit/s bottleneck. We are going to set up a dedicated VLAN between our web servers and database servers that uses dedicated NIC ports. This dedicated path also won’t traverse the router making sure there isn’t a gateway bottleneck. The database traffic from the web tier will have its own dedicated interfaces that don’t have to share the path with our redis caching traffic and http traffic. Lastly we will bond these with an active-active method that will give us more throughput.
We don’t know if this will help prevent this problem or not, but we all think it is a better architecture so either way it is an optimization worth doing.
A Lesson in Troubleshooting Complex Problems — Document As You Go
The biggest mistake we made in this process so far in my opinion was not documenting our troubleshooting while we are doing it. By the time we got to Friday, we had a lot of data points. There were enough that we had trouble keeping them all in our head. That made it hard to make sense of them and our thoughts would go in circles at times. Even worse, we questioned if what we remembered and if our tests were even accurate.
Going forward I think we should use a collaborative document system like Google Docs to document our troubleshooting and any ideas we have as we go. Each test we do should include:
- When the test was run in UTC time and who ran it
- Screenshot(s) of the test. This is very important so people can verify the results, and repeat the test.
- Attachments and/or links to where the file is of logs and things like capture. Captures should include screen shots of graphs and analysis as well.
- Whatever conclusions you think can draw at the time from the testing as it relates to the problem.
With this on day two we can look at what we have done so far and what the sum of it all what logically might mean. Also, when people are taking breaks or are away, when they come back they can get caught up on what is happening. In the long run it will save time and make the troubleshooting more effective. We can still use an open phone line to communicate, but this would record the most important tests and ideas.
I really hope we stay calm enough and have the discipline to do this text time we deal with a major problem.
With all my talk of doing things in a scalable way comes a requirement, and that is that we actually accomplish this stuff in practice at Stack Exchange. We have been making a lot of progress in this area. George has been refining and expanding our deployment process. He improved our Windows deployment to include most of the software we use and has made it so kickstart for CentOS/Linux installs are integrated into our deployment as well.
Scaling your ability to manage your environment in my mind means doing more with less. I find I really only have to ask myself one question to quickly gauge if we are doing it right or not.
Do I have to repeat steps to do this task on multiple servers?
I like this question because it is more specific than “Is it automated?” while still implying automation. It is akin to the DRY rule in programming: “Don’t repeat yourself.”
When it comes to our environment, here is where we are at. For this I will ignore some details — for instance, we log into servers to kick off a PXE install and then just let it go — I consider that a Yes to “No repetition required” since it is only one or two steps and we don’t really deploy more than a server at a time. We don’t want to automate to the point over engineering beyond the projected size of our environment.
| Task | No repetition required | Solution or Proposed Solution |
|---|---|---|
| Windows OS Deployment | Yes | Microsoft Deployment Toolkit with LiteTouch |
| Linux OS Deployment | Yes | WDS which redirects to PXELinux and Kickstart |
| Windows OS Updates | Yes | Windows Update Services |
| Linux OS Updates | No | Kick them off with Cron or Puppet? Spacewalk? |
| Windows Firmware Updates | No | Exploring what Dell has to offer that might tie into System Center |
| Linux Firmware Updates | No | Run binaries with Puppet? (kind of scary) |
| Windows Software Deployment and Updates | No1 | Microsoft System Center |
| Linux Software Deployment Updates | Yes | Puppet† |
| Windows Configuration Management | No (with the exception of IIS and web related configs) | Microsoft System Center |
| Linux Configuration Management | Yes | Puppet† |
| Automated Deployment of Monitoring and Backup Configuration | No | No ideas at this point |
1We do have some software that can be deployed via GPO, and LiteTouch deploys a lot of stack on the web servers during deployment. But future software updates and software that doesn’t lend itself to GPO is manual.
† I am currently in the middle of rolling out puppet so it is partially deployed on some of our Linux servers
The big picture of all of this is deployment as phase 1 and maintenance as phase 2 for both Windows and Linux. Also, ideally these phases connect to each other seamlessly.
One of our main goals is to change all of the above “No” to “Yes” over the next few months and then refine each step. For the most point we have deployment taken care of for both Windows and Linux. As far as maintenance goes, I believe as I progress in rolling out Puppet that will solve the vast majority of our Linux needs. How we will manage our firmware is still an unknown. As far as Window maintenance goes we are going to start exploring System Center soon and hope that it can meet our needs.
What I really think all of this will buy us is consistency, recoverability, and most importantly — time. By having all of this centrally managed it will make our servers more consitent with each other — and make them effectively drones. By having these processes automated we will be able to recover fast and replace servers easily. Lastly, and most importantly it buys time. By making our management faster and more agile, George and I can focus on rapidly deploying improvements to our environment instead of just maintaining it. By having less friction to deploying changes to our infrastructure I believe more possibilities for improvement will start emerge.
Windows 2008 and broken ARP
George Beech
A couple of weeks ago we had one of our edge routers go down on us. Nothing bad happened, failover to our secondary router work just as expected. Now, we saw something wierd this week when we looked at the internal interface graph for our secondary router.
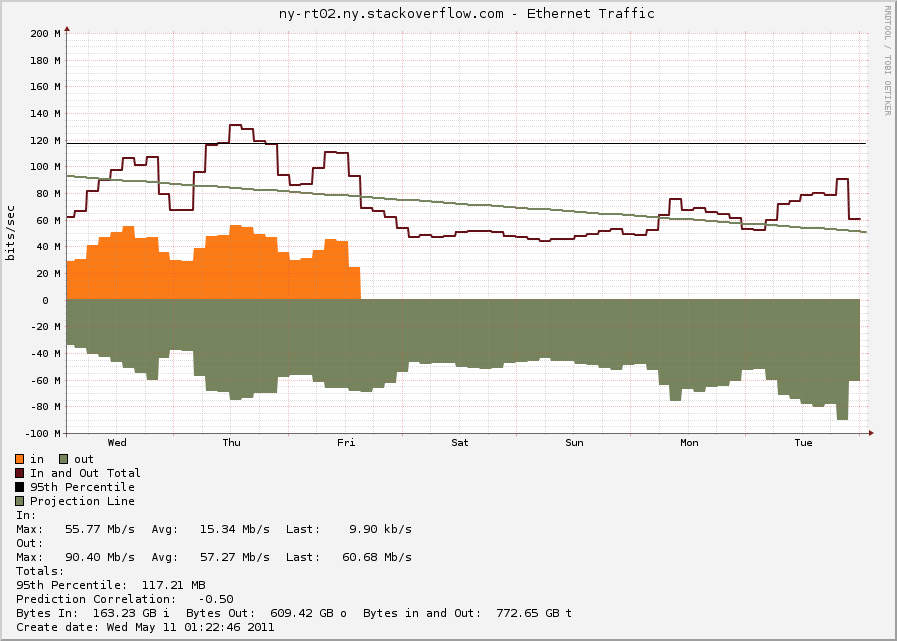
I’ll give you a second to try and see what we saw – although I don’t think you’ll need a whole second to see something very very strange going on with this router. That’s right, there is a whole lot of outbound traffic on this router, but ZERO inbound traffic. The next question we had was what could possibly be causing this? I really don’t think that I could be anything good.
You can clearly see on the graph where we failed back to our primary router. But, after that there is still a ton of traffic that is traversing our secondary router when there should be very little traffic going through there.
After some digging around we found that our Windows servers had the wrong ARP address for the VIP of our routers. That’s right, Windows still had the wrong ARP address after the fail back to the primary router, it even had the wrong ARP address days later.
How could this be possible? I was stumped after some digging around it seems that Microsoft changed the way that the network stack handles Gratuitous ARP packets (GARP packets) with Windows Vista/2008 RTM. This change has persisted through to Windows 7 and Windows 2008 R2.
What is Gratuitous ARP?
Gratuitous ARP is when a system sends out an ARP packets announcing to all system what it’s MAC address is. You generally see these in HA environments that make use of Virtual IPs that can move back and forth between machines. You will normally see a machine issue a GARP packet when a fail over event occurs and the new machine picks up the VIP. Wikipedia ARP article for more info on the ARP protocol
What did Microsoft Change?
There is actually very little information out there about windows and how it handles GARP. The best resource i’ve found that gives a very good overview of the new windows networking stack is a very well written technet blog. About 3/4 of the way down there is a section named “Changes to ARP cache updating” within this section lies the answer to all the mystery of our weird network bandwidth.
>First, a Windows Vista or Windows Server 2008 will not update the Neighbor cache if an ARP broadcast is received unless it is part of a broadcast ARP request for the receiver. What this means is that when a gratuitous ARP is sent on a network with Windows Vista and Widows Server 2008, these systems will not update their cache with incorrect information if there is an IP address conflict.
>Additionally, when a gratuitous ARP is sent by a Windows Vista or Windows Server 2008, the following change has been made – the SPA field in the initial request is set to 0.0.0.0. This way the ARP or neighbor caches of systems receiving this request are not updated. So, if there is a duplicate IP address, the receivers do not need to have their cache corrected.
The question is why is this such a big problem for Microsoft? Well the answer is they have hi-jacked the GARP packets for their Address Conflict Detection mechanism. You know that pop-up that says “Another machine on this network has been detected with the same IP address”. With previous version of windows they had the same mechanism, but still respected the normal GARP packets, thus there would sometimes be an issue with Windows systems updating their ARP cache with invalid data. They fixed it by breaking GARP.
Why is this a problem?
Beyond the issue we have seen with Windows 2008 not respecting GARP packets this can cause other wierd problems. One example I can think of off the top of my head, is that for HA systems that use GARP to facilitate moving the VIP when a system goes down is that you will now have to wait for the OS to timeout the neighbor cache. This will add more time to your fail over, possibly causing things that are expecting a quicker fail over to break.
Is there a Fix?
I have not been able to find a fix for this. Although there is very little information out there on Windows networking at that low of a level. If you know of a fix to this issue I’ve started a question on Server Fault.
Broadcom, Die Mutha
Kyle Brandt
Until a year ago I never really thought much about NIC vendors. I figured if you bought Intel or Broadcom you were safe, maybe if I was doing near Gigabit speeds constantly or iSCSI I would have to pay more attention, but other than that I figured I was good.
Man, was I ever wrong.
Fail #1
This all started almost a year ago in our Oregon data center. In fact it was one the first things that was handed back to me when I started. On our web servers after upgrading to Windows Server 2008 R2 after about a week or two we would lose connectivity on a web server. 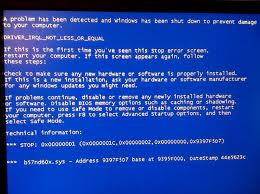 This was happening to all the web servers, just not at the same time. After losing connectivity when you went to reboot the server it wouldn’t. You had to wait about 10 minutes for the BSOD to come and then the server would reboot (More at Windows Server 2008 R2 network adapter stops working, requires hard reboot).
So we raised a case with Microsoft and after a month of back and forth and some kernel patches we still had the problem. So we tried some Intel NICs and the problem went away.
Fail #2:
Now in our NY data center (Dell hardware instead of IBM, but still Broadcom NICs) I saw some packets being lost and various network timeouts recently. So I updated the firmware on a test server and a couple days later updated the rest of our web servers. I saw no improvements so I started to dig deeper into some tcpdump data with Wireshark and I see the following sorts of ARP requests coming from the servers:
17:03:41.187682 ARP, Request who-has 89.145.83.164 (00:21:9b:a2:c9:be) tell 64.34.119.21, length 46
17:03:41.187684 ARP, Request who-has 74.125.91.109 (00:21:9b:a2:c9:be) tell 64.34.119.21, length 46
17:03:41.187686 ARP, Request who-has 64.34.80.179 (00:21:9b:a2:c9:be) tell 64.34.119.21, length 46
ARP is used to find the MAC address of servers within the same network. In fact it is at the foundation of the network stack that much of the Internet is built on. There should never be ARP requests for IPs outside of your network (More at Windows 2008 R2 Servers Sending Arp Requests for IPs outside Subnet). This disappeared when I disabled failover teaming and came back when I enabled it again.
Fail #3:
Now about every week I am getting corrupted arp tables. Deleting the table with arp -d usually results in the table not being rebuilt, or if it does it shortly fails again after. The solution is to reboot the server. So I called Dell and they can’t help me because it is a software issue. So now we are right back where we were with our NICs in Oregon.
Solution:
We are replacing our Broadcom NICs with Intel on our primary production boxes. We replaced one of the NICs with an Intel NIC a couple weeks ago and have not seen either of these problems in that server so we are going to do this with the rest of our servers.
I don’t ever want to touch a Broadcom NIC again. Intel is a company that makes more sense to me anyways as their engineers are more frequently part of what I think of as the fabric of the Internet. Last issue I had with an Intel product I posted on their free mailing list and got a response from an Intel engineer within hours. The best thing to do at this point I think is to take these Broadcoms out to the field:
Network Work this Weekend
George Beech
I will be upgrading the Stack Exchange network’s switching infrastructure on Saturday February, 26th. There should be minimal downtime while I do this, however the sites may be a little slow as I work through the Web Tier. Additionally there will be about a 10-20 minute complete site downtime while I move the DB servers and routers.
What exactly will I be doing? Why, I’ll be removing our current Dell PowerConnect 5448 switches and replacing them with Cisco 2960-S-48TS-L switches.
The plan is to start working on moving the web tier Saturday afternoon and be finished moving all services by early evening. I will post to Blog.Serverfault about one hour before the start of work.
Our Storage Decision
George Beech
We’ve been trying to figure out what to do about the Disk subsystem IO problems we have. We spent many hours talking to vendors, trusted advisers (ok, reaaaally smart people who were willing to help us – and put up with our questions), and each other trying to find the best solution. We think we have, for now.
Before I get into what we decided to do I want to talk a little about our thought process and the requirements we put together to shape our decision.
Requirements
It should be fast
I know this may seem silly but we pride ourselves on the fact that our sites load not just fast but really fast. We needed a solution that didn’t just get us to the point where our storage subsystem was good, but decimated that barrier and made it great. The added benefit to this approach is we should be able to handle the IO needs of our sites for at least the next year or so. (Assuming our growth rate projections are accurate, of course.)
It should be reasonably priced
The primary requirement of this upgrade was to get more speed out of our storage subsystem, so it makes no sense to spend $100k or more on a SAN with a whole bunch of features that we won’t use in the next 6-12 months. But we don’t want to spend the least amount of money we possibly can on equipment, either. Like Goldilocks, we needed to find a solution that was just right.
It should be reasonably safe
By safety, I mean our data won’t go up in smoke when there is a catastrophic failure — and it needs to keep our services running briskly without a ton of overhead, either mental or physical. We’re not a bank, and we don’t need to over-build our systems to never lose a single bit and always be 100% accurate. But we also respect that you put a lot of effort into making this place great, and we owe it to you to treat the content you’ve contributed with care.
Putting aside all the cool stuff, all the other feature options, does spending X on storage technology Y give us the best price/performance?
Research
The first thing we did is to explore the different classes of server storage, and look at the pros and cons of each.
1. Direct Attached Storage enclosures
Cons: Normally can only be connected to a low number of hosts (1-4), for what you get, it’s a large investment.
2. SAN technologies
Cons: Very expensive. And to get the best performance we would need an infrastructure upgrade as well, either 10 Gigabit Ethernet or Fibre Channel.
3. PCI bus based flash drives (FusionIO)
Cons: relatively new tech, giant single point of failure with no great way to compensate for it.
4. Traditional Solid State Hard Drive (SSD) storage
Cons: Have to get non-vendor “approved” drives, since our vendor wanted insane amounts of money for a single drive.
Evaluation
We had grandiose plans to bring a few of the finalist options in house to do a barrage of tests, but this turned out to be harder than we thought. Storage vendors were really reluctant to allow us to bring in demo units of their hardware. When I’m looking to spend tens of thousands of dollars, I’m sorry, but I really want to either a) go to your lab and actually run test against a unit that I’m going to be buying, or b) bring a unit in house for a few weeks or a month and be able to verify that the unit will do what you claim it will. What actually happened was that we only brought in one option: the Intel X25-E solid state hard drive. The price wasn’t too expensive to bring them in on a flier, and if they didn’t work out we would be able to re-purpose them somewhere else so it wouldn’t be a total loss.
We decided to use Brent Ozar’s benchmark that he did on the FusionIO drives as our benchmark. Brent isn’t some random blogger, you understand — he is a database ninja. When he does a benchmark, he does a benchmark.
Here’s a quick comparison of our results and his:
Random Reads — 2 threads, 8 outstanding requests, 64k blocks
| FusionIO | Intel X25-E in RAID10 |
|
| MB/s | 1424 | 1064 |
| IOs/s | 22788 | 17023 |
Random Writes — 2 threads, 1 outstanding request, 64k blocks
| FusionIO | Intel X25-E in RAID10 |
|
| MB/s | 632 | 584 |
| IOs/s | 10114 | 9337 |
The numbers for the X-25’s are actually limited by the controller since the H700 has a max throughput of 600MBps. We do not know how much faster this setup could go if we put a higher throughput controller in the boxes.
We ended up not bringing in any of the SANs due to the amazing performance we got out of the Intel X25 solid state drives. Speed was all we were really after. We don’t seen the need for a SAN at this point so we’ll let that money continue to earn interest in the bank for now.
The full test that we ended up running was straight out of – you guessed it – Brent Ozar’s playbook. That us, using SQLIO to run a whole barrage of tests against the storage system.
The test system consisted of:
- Dell R710 with 96GB of memory
- 2 Xeon X5680 CPUs
- 6 Intel X25-E drives in a RAID 10 array
- H700 RAID controller with 1GB of memory
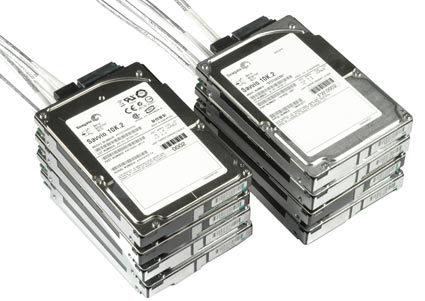
The gold standard for fast is the FusionIO drives. In our benchmarking, a RAID 10 array of Intel X25 drives got within about 25% of FusionIO performance for reads, and within 10% for writes. That exceeded everyone’s expectations and made our decision very easy. Six X25-E’s are about half the list price of one FusionIO, and putting them in a RAID array eases any concerns about reliability.
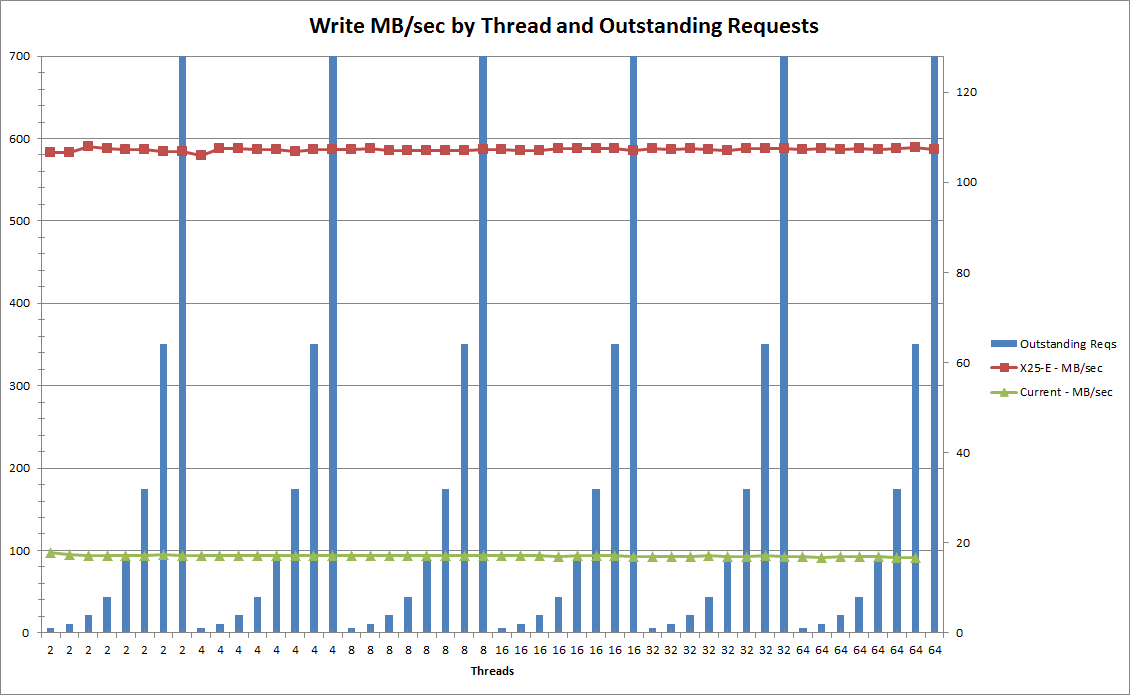
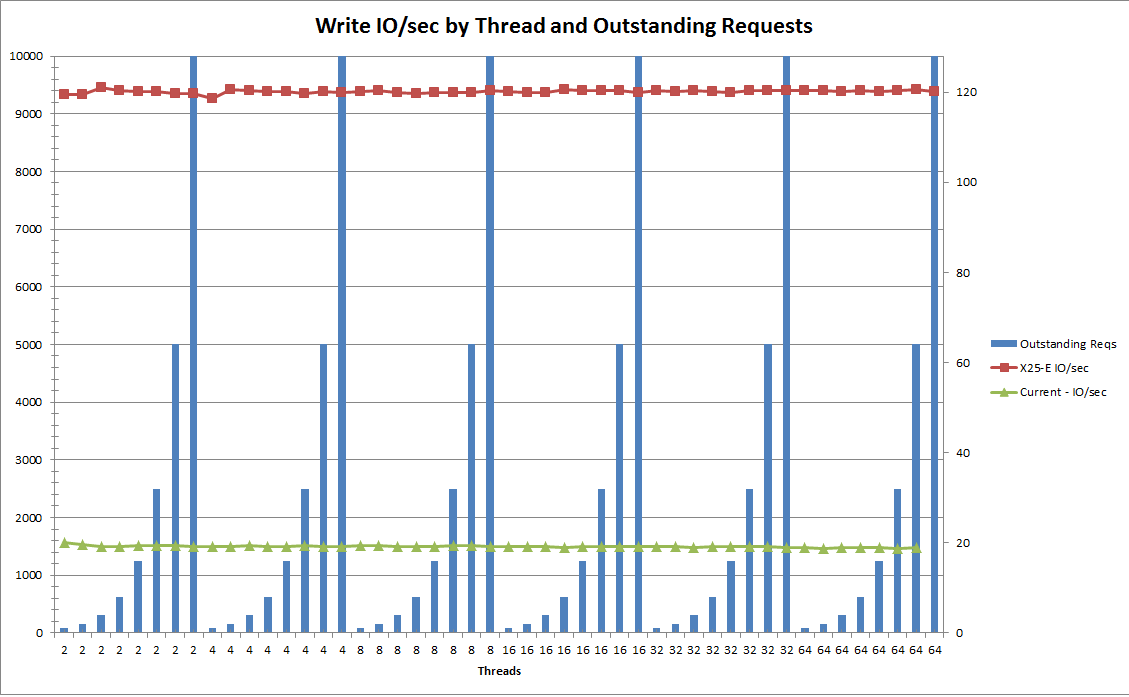
For all who are interested the raw data can be found in this archive. The archive also includes a pretty ugly Perl script that converts the raw output from SQLIO into a csv file.
> I would like to take a moment to thank all the people who helped us out looking at all these options. > > – Our vendors who put up with insane questions and flip floppery – Dell, CDW, and Fusion-IO. > – All of the regulars in the Server Fault chat room. > – Of course Brent Ozar who … is … godlike? Hmm, let’s just go with “great guy”.
What to do about Storage?
Kyle Brandt
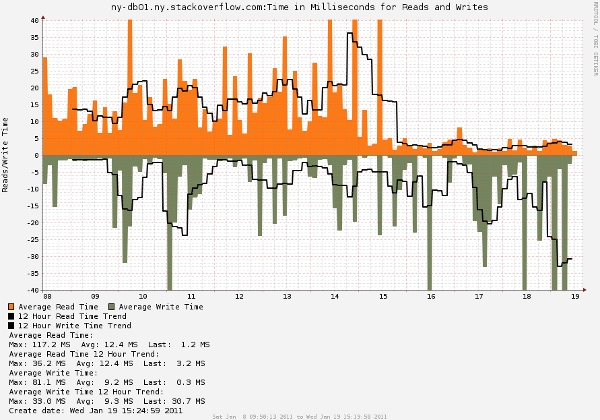
If you are really observant you may have noticed in my RRD graph post that our write times on our database server are not so hot:
Also looking at this from SQLs perspective confirms this:
Our sequential log writing however is really fast (<10ms), but there is a write performance problem when it comes to our database files that we need to fix.
Too Many Variables
Figuring out what direction to go in with our storage is proving to be quite challenging. The main reason is that there are just so many variables:
- Cost and The Total Cost of Ownership (TCO)
- What will satisfy our needs and prepare us for growth?
- What gives the best performance for our workload and how is that workload going to change?
- Reliability and fail over options
- What direction is storage heading in as far as technology goes
- What fits our scaling pattern
Right now we are thinking about 3 main options:
- A PCI card storage solution like a FusionIO drive
- A SAN
- SSDs in the servers themselves
However, before looking at these options there are some fundamentals and issues to consider when it comes to storage.
The Problem with Figuring Out what is Needed for an IO Workload:
When it comes to analyzing IO workload there are some basic questions that must be answered:
How Much?
There are two main measurements used to answer the question of “how much?” with storage. There is how much data is moved within a certain amount of time (MB/s) and/or how many logical operations there are (IOPS or input/output operations per second). When looking at the workload the amount of operations in the queue is also considered for data that has a steady rate.
How Much of What?
The operations are either going to be reads or writes. The reads or writes will also be either sequential or random. So you end up with some blend of the following four possibilities:
- Sequential Reads
- Sequential Writes
- Random Reads
- Random Writes
What is the Shape Over Time?
Sometimes the shape of IO will be a steady stream of data, but often disk operations will get batched to make the IO more efficient. This means that the shape of the IO will usually be spiky on a micro level (say over several seconds). There will also be a shape on the macro level because most services have peak usage times and there are also scheduled IO intensive operations such as backups.
How Fast?
With whatever workload, operations need to be fulfilled within a certain amount of time. If the disk IO system is busy, then operations have to wait in a queue to be fulfilled.
My main point with all of this is that it is not advisable to just take an average of the amount of IOPS and Megabytes per second over a day and go buy a storage solution. This does not account for how fast these IOPS are satisfied or the shape of data over time. Even if these are taken into account, and taken into account correctly, the workload still should be tested on the actual equipment. The best an analysis can do is give a hypothesis. This leaves two possible courses of action:
- Take an educated guess and buy something
- Set up a demo unit or go to a demo location and load test the application
The main problem with option number 2 is that this is a large time investment, and that you have to have the capability to load test your application in a way that accurately reflects real world usage.
My Personal Gripe with Storage Vendors
My gripe is that most large or fast storage solutions can not be purchased at Micro Center. More seriously, even when talking to a sales person on the phone they won’t say what all the options are and what they really cost. Sometimes there is an option to price them out on the website, but the real cost is what the sales person will knock it down to. The sales people want the data I was just talking about (often a limited subset which will only give them a rough ballpark). I have always hated this sales method, I want to see what I get for certain costs — not tell them how much I can spend and have them tell me after that.
The other big thing is that vendors are not public with their actual performance numbers. The SPC1 benchmarks are the best effort I have seen to provide useful information, but the amount of devices in that repository is limited. To a degree this is understandable given all the different workloads as I mentioned, but some basic numbers on various workloads under a Raid 10 configuration would be nice. In other words “Give me some data, please”.
Our Particular Situation and Scaling Model
The sheer size of the stackoverflow.com database compared to our other sites at the moment is a major factor for us. Looking at the above image the amount of IOPS on the stackoverflow.com database is 30 times the amount of IOPS for the superuser.com database. Because of this treating stackoverflow.com’s database as a separate entity for the other databases does make sense.
We also don’t need that much capacity. Going off of Nick Craver’s growth analysis the SO Database will grow from 85 GB to 256 GB over the next 36 months (note: this is just a projection).
I have mentioned this before but our model has been to strike a balance between scaling up and out. We are not particularly attracted to building giant monster systems, nor do we want a bunch of cheap little boxes. We want a balanced amount of medium powered servers. In my mind this fits well with a Microsoft stack.
The Current Options
So taking the above into account here is my current thinking on what the following options might mean for us. We don’t have any demo units in hand yet but our plan is to evaluate FuisionIO as the PCI card option, Equallogic as the SAN option, and Dell approved SSDs put into our current Dell r710 database servers.
Option 1: FusionIO
Pros:
- FusionIO is going to be the fastest option out there. To quote Brent Ozar in his review of FusionIO: “The only way to outperform a Fusion-IO drive is to invest six figures in a SAN and hire a really sharp SAN admin.”
- Simplicity. There is a lot that goes into configuring a SAN correctly, with FusionIO we would copy our database file to the FusionIO drive and be done.
Cons:
- Limited single system availability. There doesn’t seem to be a simple RAID equivalent. For each single server there will likely be only one of these cards in each server. Two can be put in a server and set up to use software RAID but I wonder if that might just end up lowering the availability. In theory since these are solid state devices and not mechanical I would expect to have better reliability than hard drives, but the technology is still fairly new.
- Limited multi-system availability. Any sort of SQL clustering options are out the window and what you have left is log shipping and synchronous or asynchronous mirroring.
I think the FusionIO option fits our scaling model well. We currently have two DB servers — a primary and a fail over. We are planning on expanding to 4 servers so Stack Overflow (and maybe the rest of the original trilogy) can have its own primary and secondary server. There are different options, but one 640GB FusionIO would cover growth for the trilogy and provide the fastest speed compared to a SAN or SSDs. We could then have asynchronous mirroring to the secondary server and in a failover situation Brent Ozar estimated 90 seconds of data loss. Downtime might be around 30 minutes until we get the secondary server up and going manually. We generally favor speed over the highest possible uptime. It is not that we are glib about the uptime of our service, but we don’t have the uptime requirements of a financial institution. For our sites with higher uptime requirements such as Careers we can use the storage in the servers and possibly synchronous mirroring. I also imagine either this or SSDs in the servers themselves will be the cheapest solution — the 640GB drives were quoted at about 10k each for us and the 320GB at about 6.5k from a vendor.
Option 2: A 10GE EqualLogic San with some SSDs
Pros:
- Flexibility in growth and tiered storage. With a SAN we can add shelves as we grow and can tier our storage effectively. So for example we could have an SSD array for the trilogy and a SAS array for our smaller sites. As our sites grow we could move them accordingly. We could also use storage for logs or tempdb.
- Flexibility in availability options. Unlike a fusion drive or SSDs in the server clustering options are now open to us.
- 10GE might be useful for other things if we start to hit network bottlenecks. This is the main reason why 10GE appeals to us more than fiber.
Cons:
- The SAN as a logical unit is a single point of failure unless you buy two. I know these have lots of built-in redundancy but nonetheless our current thinking is that we would want two if we went the SAN route.
- Cost. These things are not cheap. The EqualLogic PS6010S with 8 SSDs is priced at 46k on their site. The redundant 10GE switches if we go with Dell would be about 20k. So without even factoring in other various total cost of ownership factors if we want two SANs we are talking well over 100k. That would be the same cost as getting at least 8 more of our current database servers.
The flexibility and growth options that a SAN offers are appealing. The cost could drastically change if we decided we could live with one SAN, look at different vendors, or give up on the option of having SSDs in the SAN. The performance won’t be as high as the FusionIO would be but for our workload that extra performance might not really matter.
Option 3: SSDs in the Dell Servers
This option would be pretty similar to the FusionIO option except that there will be a trade off of an increase in single server availability options but a decrease in speed. With SSDs we can use a traditional RAID configuration in the servers. These drives on Dell’s site are 4.6k for a 2.5 inch SAS 3 Gbps drive, so for a mirror of two drives it would be $9.2k and would give us 150GB capacity. This wouldn’t leave us much room for growth so we would probably want 300GB capacity. In RAID 10 that will cost about 18.4k. At the moment I don’t have any data on how this would perform but with the current cost of the Dell approved SSDs for our servers this option isn’t too appealing to me yet.
Conclusion
Right now we are still in the preliminary stages. Initially I am fond of the FusionIO option where as George is more in favor of a SAN. One of the main reasons I favor FusionIO at the moment is that it would satisfy our growth in the short term, interestingly enough this is one of the reasons George is less fond of it. George’s main reason for a SAN is that we get greater flexibility with the features a SAN offers such as the ability to fully cluster, use snapshotting, full LUN replication, and dynamic expansion (on some models). By going the SAN route earlier and not later we don’t put off solving the problem until about a year from now when it might be harder to change our infrastructure. If we were to get a SAN now we will learn how to use the advantages given to us by the SAN’s flexibility. I generally agree with this philosophy but not in this particular case. The reason I favor putting off a SAN is that I feel in a year or so the SAN options that include SSDs might be a lot cheaper and more attractive. Also the FusionIO option fits well with our current scaling model. Although the growth of our Stack Exchange sites looks very promising to me, I feel it is too early to predict how they will grow. This is not so much in terms of visitors but more in terms of the IO workload growth. Our developers could make changes that greatly effect our IO workload. So we might have a much better understanding of what we need 6 months to a year from now than we do currently.
What we really need is to get more data on the performance of these various options and get our hands on some demo units. I feel like all 3 of these paths are valid options. Also there are valid options we haven’t looked as closely at yet (for example SANs that don’t support SSDs). At this point it is clear that choosing a storage route to take is no small task.
