Monitoring Systems – Your best friend. Really.
Peter Grace
At some point in your career as a Systems Administrator or other Person-Of-Responsibility-in-IT, you will find yourself stuck in the unfortunate position of cleaning up a mess that was totally preventable, if you had known the signs beforehand that the problem was imminent. This fact is 100% assurable, as I have yet to meet a seasoned SysAdmin who didn’t have a war story similar to “man, if I was only monitoring disk space on server X…”
Monitoring is an extremely important tool in your arsenal of preventative measures. Monitoring is important for a great deal of different reasons:
- Monitoring allows you to send alerts if certain conditions are met,
- It allows you to visualize trends in data,
- Provides a method of assurance to the customer that their consumed services are guarded,
- Allows you to do internal benchmarking for when you need to come up with budget/spend numbers.
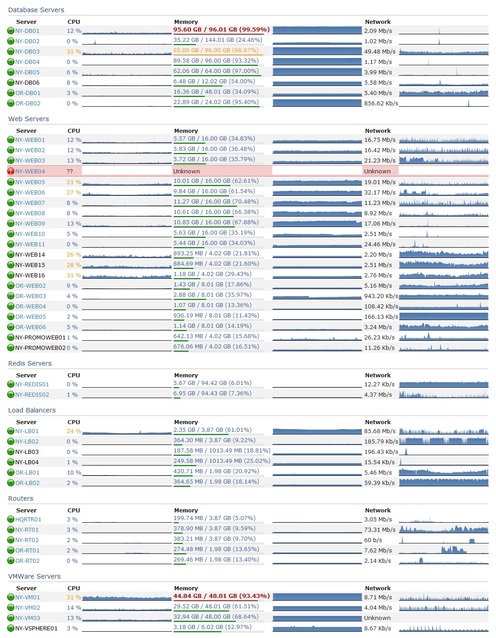
There are many different products in the monitoring sphere. Some are extremely expensive and meant only for enterprise use and there are many that are open source and therefore free to use. My personal favorite is Nagios, though it does have some shortcomings that I will touch on later. Most monitoring systems follow the same basic recipe: You configure hosts, which in turn have services or metrics you want to monitor. The monitoring system will “optionally” alert you if you configure it to do so. Most monitoring systems have a method of keeping historical data and graphing it. This is not only a great way for you to look at pretty graphs; the management staff will get excited seeing information visualized in a way they’re used to seeing.
There are several methods of monitoring. The most basic and least useful method alone is a simple ping test. Products that provide this feature give you a simple up/down alert if there’s an outage, but honestly, the users breaking down your door will be a more effective alert. Most monitoring systems will give you the ability to not only run ping tests, but also have checks that incorporate SNMP (Simple Network Monitoring Protocol) statistics. This is better than a simple ping test, but in my opinion still short of the complete picture I’d like to see. SNMP does have its benefits, though: since it’s been around practically since the beginning of time, lots of equipment supports it out-of-the-box. It’s the primary method one uses to gather statistics about your routers and switch interfaces, including drops/discards and packet saturation rates.
Going beyond simple ping and snmp monitoring, many monitoring applications allow you to have custom checks that give you metrics for items SNMP misses.
For instance, the nagios plugin exchange provides a plethora of check-metrics that other users have written with varied themes from temperature probe
monitoring to advanced Microsoft SQL statistics checking. In particular, one Nagios addon that I cannot live without is the “nagios-wsc” project, which you
install on a windows IIS server and it in turn provides the ability for Nagios to check windows statistics over WMI. Being able to do this vastly
improves the metrics you can extract from windows servers. At the time of this writing, I’m not sure if a similar interface for PowerShell exists or is
in the works, but that would be a “must-have” addon, as Microsoft has said that they’re moving away from WMI in favor of PowerShell, at least as far as Exchange
is concerned. (As commenter Jim Butts points out, I don’t have citation for this and so I’m going to strike it from the post, though I swear I remember reading at one point that Microsoft intended to replace WMI with PowerShell. This might have only been related to the Exchange family of products, though, so don’t take it as gospel. Also worth noting, as another commenter explained, WMI and PowerShell are two different technologies meant to do two different things. WMI is an instrumentation interface, whereas PowerShell is a scripting language. It just so happens that you can get some information with PowerShell that you cannot easily get through the WMI interface.)
One of the major pieces of any monitoring environment is the ability to alert administrators of an impending problem. Many admins default to e-mail for this, but not many people realize that most mobile phones are fantastic SMS modems. Find a prepaid model that lets you send SMS’s from a serial/usb connection via AT commands, and now you have not only an out-of-band notification method, but you’ve saved yourself a bunch of money on specialist hardware. I’ve also heard of some people using Asterisk to do voice-dial alerts; when the alert hits the system, it Text-to-Speech’s the alert and then plays the audio over a telephone call to the remote party. Pretty slick and high tech, but in my opinion that’s a rather big system to rely on for monitoring. Generally, simple methods of alerting, with less moving parts, makes for a more stable and trustworthy alerting platform.
A helpful part of many monitoring systems is being able to group hosts and services into logical containers. This ability lets you not only monitor a whole logical service from one view, but also allows you to quick-add new servers to a group and immediately have that server’s checks already applied to it by virtue of being a member of the host or service group. If your monitoring system supports grouping and you are not using it “you are doing it wrong.”
Do you need a monitoring environment? Yes. There is no other answer to this question. If you have even a single server in your environment, monitoring it will provide a treasure trove of information about the system. The only question is, how much do I have to monitor? This depends a lot on your customer SLAs and the expectactions of uptime. As the uptime target grows and the margin for error shrinks, you will need to squeeze more and more information out of your environment to maximize the “magic twilight” between a server showing symptoms of impending troubles and “THE SYSTEM IS DOWN.”
Having a lot of stuff monitored also helps with correlation and causation. For instance, you might have a website error showing up on one of your servers, and you start diagnosing that error. Thirty minutes later, you come to find the problem was that the SQL server is bogged down and replying to queries too slowly. If you were just monitoring the web server, you just lost thirty minutes. If you were monitoring both the SQL and the web server, you would have a greater chance of knowing that the problem lay with SQL, not with the web server. All of this data can lead to a condition I call “data addiction,” and it’s a condition that I will attest is pervasive at Stack Exchange. Many of our developers rely heavily on our monitoring data to give them metrics into how the sites are operating.
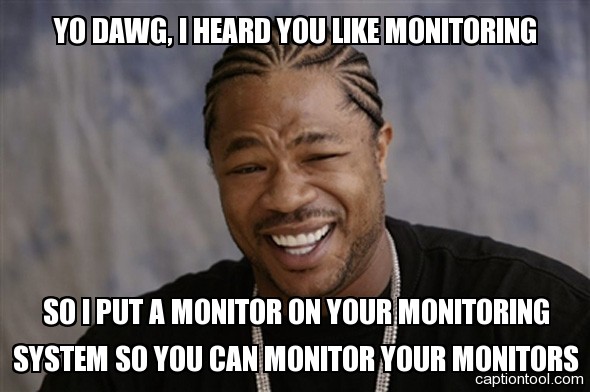
One thing that needs to be considered when you setup monitoring is the “Who Watches The Watcher” paradox. Simply put, if you become reliant on your monitoring system, you want to trust that the monitoring system is active. There are a few ways to solve this. First off, if your organization has multiple sites, setup a monitoring server at each site and have the monitoring servers monitor each other as well as their other systems. If you have only a single site, then you should probably consider getting a simpler monitoring system to monitor your monitoring system. You’ll never be able to have 100% faith that your monitoring system is foolproof, it’s tough to rely on software that was written by human hands to be 100% failure free, all the time. Regularly auditing the monitoring environment is the best way to keep your faith in the system.
In closing, I’d like to reiterate that even if you feel you don’t need a monitoring system, I’m pretty sure you would still benefit from one. Start small if this is your first time; if you run into issues, sites like ServerFault are a great resource to get good answers. Over time, I think you’ll grow to enjoy having the peace of mind that comes from knowing what your network is doing without having to spend additional time manually collecting statistics on your own.
New Hardware for Stack Overflow Database
George Beech
We’ve been doing a lot of talking about some of the growing pains we have been having with our database server. And how we are going to deal with it. Well we will be moving Stack Overflow’s database to its own hardware this Friday (2011-03-11).
When?
2011-03-11 9:00pm Eastern (2011-03-12 02:00 UTC)
Why?
To Make everything MORE AWESOME
What?
2 new Dell R710’s
- 2x Intel Xeon Processor X5680 3.33 GHz
- 96GB of RAM
- 6 Intel X25-E SSD’s in a RAID 10
What will this mean?
First, we will be putting Stack Overflow into Read Only mode again for the maintenance – just like we did when we went down the Oregon trail. Once the migration is complete, Stack Overflow will be on its own DB pair, and can run free, and the rest of the Stack Exchange sites don’t have to contend with the Megalopolis for database time, making them MORE AWESOME as well.
Server Maintenance
George Beech
I am going to be doing a bit of DB maintenance tonight at 9PM Eastern. The sites will be down for about an hour while I do a couple of upgrades to our primary database hardware:
- Add 32 GB of RAM to the server to bring it up to 96GB of RAM
- Run Firmware updates for the RAID card
- Update the RAID Card Driver firmware
The Trilogy and SE sites will be down for about an hour while I do this work. If the outage is going to last longer than that I will update this post.
Also, sorry for not posting this earlier — I’ll try to get these notifications up sooner than an hour before work is scheduled to start in the future.


