The Theoretical and Real Performance of RAID 10
Kyle Brandt
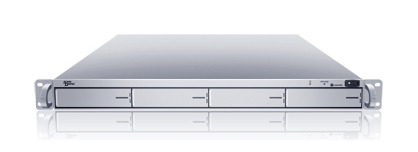
For our datacenter in Corvallis we purchased a new Sans Digital EliteNAS EN104L+XR to replace our slower QNAP NAS.
In this post I want to try to figure out what the theoretical RAID performance of this NAS should be and then compare that to the performance we actually see.
I Present the EliteNAS:
The EliteNAS, which I would have called The l33t NAS, is a Network Attached Storage appliance built on top of GNU/Linux thats boasts the following:
- 1U enclosure
- Linux OS with custom web UI
- Intel Xeon 3040 1.84GHz Dual Core CPU
- dual gigabit ethernet
- hot-swappable redundant power supplies
- four SATA ports (software RAID)
We have installed 4×1.5TB drives into this configured in a RAID 10 configuration in hopes to see a significant gain in performance over our previous RAID 6 configuration.

This device also supports gigabit bonding. When they said that it is built on top of Linux, they mean it. All of the Linux bonding options are available through the GUI, Linux Software RAID is used, and you get access to the CLI via ssh if you are so inclined, which I must say I am:
[root@sonas1 ~]# /sbin/mdadm --detail /dev/md1
/dev/md1:
        Version : 00.90.03
  Creation Time : Thu Jul  8 03:25:55 2010
     Raid Level : raid10
     Array Size : 2930272128 (2794.53 GiB 3000.60 GB)
    Device Size : 1465136064 (1397.26 GiB 1500.30 GB)
   Raid Devices : 4
  Total Devices : 4
Preferred Minor : 1
...
         Layout : near=2, far=1
     Chunk Size : 64K
...
    Number   Major   Minor   RaidDevice State
       0       8        2        0      active sync   /dev/sda2
       1       8       18        1      active sync   /dev/sdb2
       2       8       34        2      active sync   /dev/sdc2
       3       8       50        3      active sync   /dev/sdd2
The file system used is XFS with the noatime and nodiratime mount options so there is not a write to the file every time it is read. It also comes with all the standard unix tools such as tcpdump and iostat.
As for the drives themselves we have 4 Western Digital Caviar Greens (WD15EARS). These are 3Gb/s SATA drives with a 64MB cache. Tom’s hardware has a nice review of these drives which I am going to rely on for individual drive performance. The highlights from the tests are (Ballpark Avg from Multiple Benchmark Tools):
Avg. IOPS: ~120
Avg. Sequential Throughput (Same for reads and writes): ~94 MBytes/s
What is RAID 10?
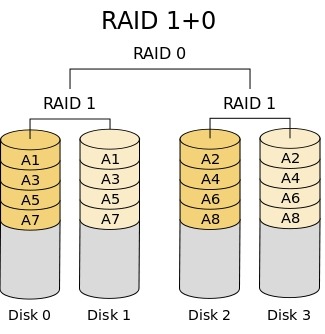
With Raid 10 some people might have discovered that there is RAID 1+0 and RAID 0+1 and you can find the difference between these talked about in this serverfault question. In this case we are using RAID 1+0:

So we have two sets of mirrors with the data striped over them. With this configuration we can lose up to two drives as long as both of those drives are not in same mirror.
What should our Theoretical Speeds of Raid 10 Be?
So I am lucky enough that Tom’s Hardware decided to go ahead and take care of the individual disk performance benchmarking as I already mentioned. So how do we figure out what happens in terms of performance when we combine them in RAID 10?
With RAID 10 the reads go over the stripe (RAID 0). So looking at our RAID 10 diagram we are reading from two RAID 1 mirrors. In this case we expect to see the sequential read performance of about two drives in RAID 0 according to the mdadm maintainer Niel Brown. If this was in the far layout configuration of RAID 10 we would get read performance on par with a 4 drive RAID 0 array but would incur a larger write penalty. For writes since we have a mirror every logical write causes two physical writes. However we have two sets of mirrors so I believe that we can expect the write performance of about a single disk. However as we will see from my benchmarks that turns out not to be the case.
Since the purpose of this device is for backups we are essentially interested in sequential disk activity because we will be streaming large contiguous files to and from the array.
Actual Read Performance:
Device:  rrqm/s    wrqm/s  r/s       w/s   rsec/s     wsec/s  rkB/s      wkB/s  avgrq-sz  avgqu-sz  await  svctm  %util
sda      7291.33   0.00    85.00     0.00  60362.67   0.00    30181.33   0.00   710.15    1.37      16.22  8.22   69.87
sda1     0.00      0.00    0.00      0.00  0.00       0.00    0.00       0.00   0.00      0.00      0.00   0.00   0.00
sda2     7291.33   0.00    85.00     0.00  60362.67   0.00    30181.33   0.00   710.15    1.37      16.22  8.22   69.87
sdb      9092.00   0.00    88.00     0.00  73440.00   0.00    36720.00   0.00   834.55    1.33      15.18  7.52   66.13
sdb1     0.00      0.00    0.00      0.00  0.00       0.00    0.00       0.00   0.00      0.00      0.00   0.00   0.00
sdb2     9092.00   0.00    88.00     0.00  73440.00   0.00    36720.00   0.00   834.55    1.33      15.18  7.52   66.13
sdc      5773.33   0.00    87.33     0.00  47552.00   0.00    23776.00   0.00   544.49    0.98      11.19  6.46   56.40
sdc1     0.00      0.00    0.00      0.00  0.00       0.00    0.00       0.00   0.00      0.00      0.00   0.00   0.00
sdc2     5773.33   0.00    87.33     0.00  47552.00   0.00    23776.00   0.00   544.49    0.98      11.19  6.46   56.40
sdd      10592.00  0.00    103.33    0.00  85906.67   0.00    42953.33   0.00   831.35    1.05      10.19  5.34   55.20
sdd1     0.00      0.00    0.00      0.00  0.00       0.00    0.00       0.00   0.00      0.00      0.00   0.00   0.00
sdd2     10592.00  0.00    103.33    0.00  85906.67   0.00    42953.33   0.00   831.35    1.05      10.19  5.34   55.20
sde      0.00      0.00    0.00      0.00  0.00       0.00    0.00       0.00   0.00      0.00      0.00   0.00   0.00
sde1     0.00      0.00    0.00      0.00  0.00       0.00    0.00       0.00   0.00      0.00      0.00   0.00   0.00
md1      0.00      0.00    33109.33  0.00  264874.67  0.00    132437.33  0.00   8.00      0.00      0.00   0.00   0.00
For sequential reading I get about 130 MBytes/s. The single drive benchmarks from Tom’s hardware were about 90 MBytes/s. So for sequential reads there is a (130-90)/90 or 44% increase over one disk. When reading over the network through SMB read performance is about 105 MB/s when copying to the disk of a remote server. So for us that means that either SMB adds an overhead of about 25 MB/s, we are hitting a network bottleneck, or that there is a write bottleneck on the destination server. This NAS has the ability to bond the interfaces so down the road I plan to implement this as see if there is any performance improvement.
Actual Write Performance:
Measuring writes with iostat doesn’t seem to work as well because I believe the writes are cached and serialized by the md device. Therefore the numbers jump around a lot. However I believe dd with a large block size and a timed write provides a reasonable benchmark:
[root@sonas1 test]# time dd of=testfile if=/dev/zero bs=1M count=100000008008+0 records in
8007+0 records out
real    2m48.763s
....
[root@sonas1 test]# echo $((8007/168))
47
So for writes we see 47MBytes/s. I tested this again with 64K block size and did see an improvement of 63MBytes/s. According to Tom’s hardware a single drive should put through about 90 MBytes/s for writes. So in this there is a (90-63)/90 or 30% decrease in sequential write performance for the 4 disk RAID 10 array in comparison to a single disk.
Oh Noes! My Theory didn’t hold up!
So there are a few possibilities here:
- My benchmarking of sequential performance is flawed.
- There is a bottleneck I am missing.
- Something is wrong with the configuration.
- My theory was wrong and I need to change it.
The first thing I did was research my benchmarking methodology of using dd to test sequential performance. I found that some people don’t recommend it. However, I used different block sizes which is one of the main concerns. Also dd writes sequentially and in our case that is what this device is used for. I was also careful to always flush my buffers before each test. Therefore I am happy with my benchmark to provide a reasonable ballpark estimate of performance for our intended workload.
For a bottleneck the two things I considered were CPU and the bus speed. According to the infallible Wikipedia 3 Gb/s SATA goes up to 286.10 MByte/s so I don’t believe that is a bottleneck. I watched CPU load during these tests and there was no significant load on either core.
For the possibility of something being wrong with the configuration I would love to hear if anyone has any recommendations. However, this is an appliance at heart so we did all the building through the Web GUI so I am not sure tweaking it is the best idea. One possibility is that there is a partition alignment issue with the these disks which have 4096 byte sectors. I am going to investigate this on my own and have also posted a question on Server Fault in hopes that someone in the community might already have the expert knowledge needed to diagnose if this is an issue.
That leaves the possibility that my theoretical expectations were wrong which seems to be the most likely. For the writes the extra 44% seems to fall short of what I would expect. I would have guessed that there would be about a 80% increase over a single disk. The idea that the write penalty due to mirroring would be cancelled out by the striping also turned out not to be true. The 30% hit also seems like a bigger hit than I would have expected.
The only real numbers of RAID 10 performance relative to a single disk that I could find were in the zdnet article Comprehensive Raid Performance Report. In the graphs comparing RAID 10 of 4 drives to the performance of a single drive I see a slight increase of write performance and a 100% increase in writes. However, it is not clear to me if this is random activity or sequential. I would expect that RAID might be a bigger advantage in random IO because of seek time.
Conclusion:
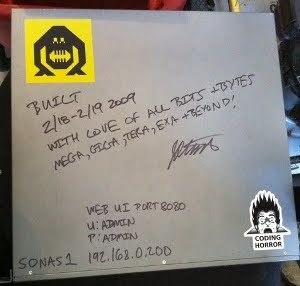
In the end this turns out to be a lot faster than our previous NAS and backups that took 25 minutes now take 5 minutes so we are happy with the upgrade. So I say farewell to our old NAS which had been given our love:

When it comes to predicting RAID performance based off of a single drive I would love to see more data for both sequential and random patterns:
- How do different drives and RAID cards perform?
- What is the formula of increase for RAID 10 and RAID 6 when you go from 4 drives to 6, 6 to 8, etc?
- How do different RAID levels actually compare in terms of single drive performance?
I think more comprehensive data could lead to betters formulas for estimating RAID performance. If these become available publicly on the net it could really help out system administration and turn RAID choice into a little bit less of a guessing game when it comes to performance.
-
Steve
-
Cody Wasser
-
Frosty
-
Hegelo
-
-
