A Network Administrator’s View:
When digging into some packet dumps to try to solve some issues I was seeing with our Broadcom network cards, something else caught my eye. When looking in Wireshark to see if there were TCP retransmits I didn’t see any in my capture but I did see a very large amount of TCP zero window messages between our web tier and our Database tier.
To follow this you need to be familiar with TCP flow control, so I will briefly cover this. Since TCP is full duplex, each side of the connection is both a sender and a receiver. However, you will often have one side doing more of one then the other. In this case with our sites it is the SQL server backend that plays the role of the sender and the web tier is the receiver. The reason for this is that the web tier just sends a database query which will be short, and the database server will send back the results of that query which will generally be larger than the query itself.
The rate of data transfer is controlled by the receiver telling the sender how much data it can receive. The amount of data that can be received is called the TCP Window. This window shrinks as the network buffers fill up. If the window fills up faster than the application retrieves the data from the network buffers then eventually the receiver will let the sender know that is can’t receive any more data for the time being. TCP informs the sender that it can’t receive more data by sending a TCP packet where the window size is zero — this is our zero window message. What this means in our case is that the sender (SQL server) is sending data to the receiver (the web servers) faster than they can process it.
So as a network administrator, if I don’t want to just blame the application, I look to what I can fix on the network side. One cause of this would be that if there is a lot a latency between the web tier and the database tier than the window might be too small. To check this the simplest way was to send pings up to the size of the MTU with the don’t fragment bit set and make them as rapid as possible. I did this but only saw peaks of 1-2 MS latency. Even if we take a view that the performance is worse than measured, the bandwidth delay product for this latency is ( (RWIN in Bytes)/(Latency) * 8 = (Max Throughput in Bits) ):
(65535/0.003) * 8 = 174,760,000
So this didn’t really seem to be the issue here since the bandwidth is lower than 174 mbit/s. Also, in Windows Server 2008 R2 there isn’t much you can do to enlarge the default window by using window scaling because Windows automatically controls this.
The other theory I had is that maybe somehow the network stack or network driver is not letting the application know that there is data to be retrieved fast enough. CPU usage is moderate so I figured that it was not a lack of processing power the web servers. The way the network stack will inform the application that there is data in the buffers is by sending an interrupt. Because at gigabit speeds interrupts can start to take up a lot of CPU power there are several tuning options for this. One option is to dedicate these interrupts to a certain core or group of cores. Another option that the NICs have to keep the interrupt CPU load low is interrupt moderation, this dampens the rate of interrupts by batching them. I tried tunning these various options to make the interrupts more frequent but I still saw a high rate of zero window messages.
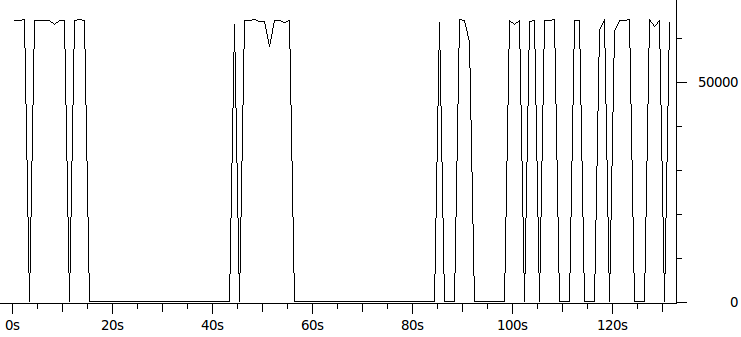
My skills as a network administrator pretty much hit a wall at this point and I didn’t get any network level answers on Server Fault that solved this issue for me. Next I turned to Stack Overflow to see if there was maybe a way to have .NET tell Windows to increase the size of the TCP window. My theory was that if the TCP window was bigger than it might stop bottoming out as it does in this graph of the average window size over time during my capture:
A Developer’s View:
When I asked about Speeding up the rate that IIS/.NET/LINQ retrieves data from the network buffers on Stack Overflow the pieces started to fall together with Remus’ answer. I wasn’t sure if what he was saying was the case, but I now had something to run with to try to get more information. With this information, I put on my admittedly somewhat shabby DBA hat.
A DBA’s View:
To verify that this might be the case I used the queries I had learned from Professional SQL Server 2008 Internals and Troubleshooting to view the SQL DMV of top wait times. One of the top wait times was async_network_io. This SQL server wait type means that SQL server has to wait because the client is not ready to receive all of the data it is sending. The problem with this DMV view is that it only shows total times since SQL server was restarted, and I needed to see which particular queries were causing the waits. So I turned to dba.stackexchange.com to try to find out how I could find the queries causing network waits safely in a production environment. The answers provided me with queries that I could run to take snapshots of queries. There were queries that frequently showed up with async_network_io wait times. I saw one query over and over again with 200-800MS of network wait. The query with “SELECT TOP 3000” and a whole wall of fields after it raised my eyebrows as that sounded like a lot of data to be sending back to the web server.
Not being that much of a DBA (at least, yet) this was about the end of the road for me. So I sent the top offenders I found to the developers and Brent Ozar.
Back to the Developer’s View:
Remus’ original answer had two theories for what might be going on:
- The client (web tier) was requesting more data than it should
- There was waiting going on while processing the data before fetching it all
The Top 3000 query was clearly more data than was probably needed and was a query constructed by LINQ. A large query in some ways make sense at first because the results of this query were aggressively cached. Also, for a while now our web tier has had CPU power to spare so moving processing to the web tier appears to be a good thing to do. However, returning large data sets to the web tier usually won’t work well, at least as part of a user request, due to the high network penalty.
The second theory is that a DataReader is being used to read the data one record at at time, and something is performed on each row before fetching the next record causing wait time between each query. I am not aware of any instances of this for our large queries yet. If there are such queries the solution might be to use a DataSet which would fetch all off the rows before processing them.
So the solution was to move the query to a background thread so it won’t slow down user response time, and of course make the query more limited in the amount of data it returns.
Back to the Network View, Meta is Murder:
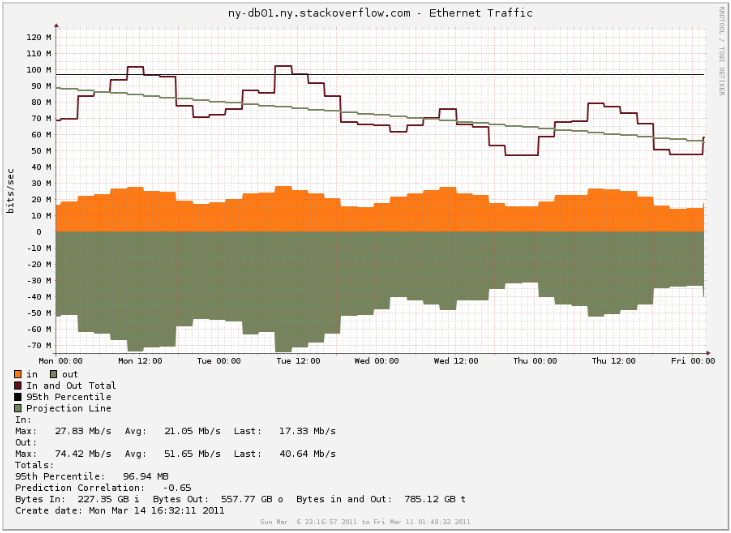
The most shocking thing is that after this query was adjusted the amount of data being sent from the database sever dropped about 20mbit/s (Notice the difference between Tuesday and Wednesday during peak hours):
So was this query really pulling this much data even though it isn’t running that frequently? The answer is both yes and no.
Since TCP/IP and Ethernet carries overhead for the headers part of the data going over the wire is just meta data added by the network. The minimal amount of TCP/IP and ethernet overhead is (See this page for more information):
(1500-40)/(38+1500) = 94.9285 % IPv4, minimal headers
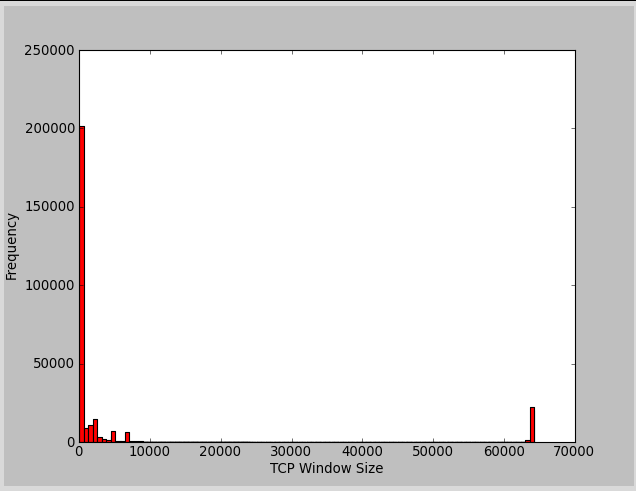
So at an optimal window TCP window size each packet will have the maximum amount of user data of 1460 bytes (without jumbo frames/vlan tagging/etc). The 78 bytes of overhead in this case is about 5% of overhead (78.00/1538.00). When our network is not hitting zero window messages the window sizes were often around 200 bytes. I made a histogram of my capture to show just how often it was in the range of small windows (resolution isn’t there to show it, but most of it is around 200):
The window size of a TCP packet will be the size of payload data minus 8 bytes since the window size is everything beyond the acknowledgement number in a TCP packet (I might be off on this calculation, I could not find a direct reference to verify this). So with a window size of 200 bytes we are sending 194 bytes of user data in a packet. So with this we have 70 bytes of overhead and 194 bytes of user data which is about 27% of overhead.
So when transferring about 100 mbit/s of user data you would only see about 5 mbit/s of extra data in the SNMP octets counters with a good window size, so from the SNMP view the transfer rate would be 105 mbit/s. When transferring 100 mbit/s of user data with a window size around 200 bytes there is 27% overhead and you end up with about 27 megabits a second of overhead for 127 mbit/s of traffic from the SNMP view. This ignores any overhead provided by the application level protocol that the web tier uses to speak to SQL server.
This pattern of window sizes is referred to as “Silly Window Syndrome” since the meta data can start to overtake the actual amount of user data being transfered. This overhead explains the large drop in database traffic beyond just reducing the amount of query data returned.
Lessons Learned
I think the biggest lesson is that the full view of many problems is missed unless each person in the team has at least some understanding of what is going on from other team members views. Also, the communication between different specialists is needed to solve many issues. In this case what looked initially to me like a networking problem was actually a symptom. Trying to attack the problem solely as a network administrator was treating the symptom, not the disease.
From a technical standpoint the difference between having the web tier and SQL servers on the same box compared to having a network connection between them is important. Things may work well on a single server, but when the data needs to be moved over the network shifting the load to web servers might not always work.
We still have a good amount of zero window packets going back and forth, so although the worse offenders have been mitigated I believe there is still might be work to do.
-
Jacob
-
Eduardo
-
Joeeee
-
Martin Doms
-
Ricardo Nolde
-
Kyle Brandt
-
-
Anonymous


