Introducing DnsControl – “DNS as Code” has Arrived
Craig Peterson
DNS at Stack Overflow is… complex. We have hundreds of DNS domains and thousands of DNS records. We have gone from running our own BIND server to hosting DNS with multiple cloud providers, and we change things fairly often. Keeping everything up to date and synced at multiple DNS providers is difficult. We built DnsControl to allow us to perform updates easily and automatically across all providers we use.
The old way
Originally, our DNS was hosted by our own BIND servers, using artisanal, hand crafted zone files. Large changes involved liberal sed usage, and every change was pretty error prone. We decided to start using cloud DNS providers for performance reasons, but those each have their own web panels, which are universally painful to use. Web interfaces rarely have any import/export functionality, and generally lack change control, history tracking, or comments. We quickly decided that web panels were not how we wanted to manage our zones.
Introducing DnsControl
DNSControl is the system we built to manage our DNS. It permits “describe once, use anywhere” DNS management. It consists of a few key components:
- A Domain Specific Language (DSL) for describing domains in a single, provider-independent way.
- An “interpreter” application that executes the DSL and creates a standardized representation of your desired DNS state.
- Back-end “providers” that sync the desired state to a DNS provider.
At the time of this writing we have 9 different providers implemented, with 3 more on the way shortly. We use it to manage our domains with our own BIND servers, as well as Route 53, Google Cloud DNS, name.com, Cloudflare, and more.
A sample might look like this description of stackoverflow.com:
D(“stackoverflow.com”, REG_NAMEDOTCOM, DnsProvider(R53), DnsProvider(GCLOUD),
    A(“@”, “198.252.206.16”),
    A(“blog”, “198.252.206.20”),
    CNAME(“chat”, “chat.stackexchange.com.”),
    CNAME(“www”, “@”, TTL(3600)),
    A(“meta”, “198.252.206.16”)
)
This is just a small, simple example. The DSL is a fully-featured way to express your DNS config. It is actually just javascript with some helpful functions. We have an examples page with more examples of the power of the language.
Running “dnscontrol preview” with this input will show what updates would be needed to bring DNS providers up to date with the new, desired, configuration. “dnscontrol push” will actually make the changes.
This allows us to manage our DNS configuration as code. Storing it this way has a bunch of advantages:
- We can use variables to store common IP addresses or repeated data. We can make complicated changes, like failing-over services between data centers, by changing a single variable. We can activate or deactivate our CDN, which involves thousands of record changes, by commenting or uncommenting a single line of code.
- We are not locked into any single provider, since the automation can sync to any of them. Keeping records synchronized between different cloud providers requires no manual steps.
- We store our DNS config in git. Our build server runs all changes. We have central logging, access control, and history for our DNS changes. We’re trying to apply DevOps best practices to an area that has not seen those benefits so much yet.
I think the biggest benefit to this tool though is the freedom it has given us with our DNS. It has allowed us to:
- Switch providers with no fear of breaking things. We have changed CDNs or DNS providers at least 4 times in the last two years, and it has never been scary at all.
- Dual-host our DNS with multiple providers simultaneously. The tool keeps them in sync for us.
- Test fail-over procedures before an emergency happens. We are confident we can point DNS at our secondary datacenter easily, and we can quickly switch providers if one is being DDOSed.
DNS configuration is often difficult and error-prone. We hope DnsControl makes it easy and more reliable. It has for us.
Some resources:
- The github repo
- The documentation site (with Getting Started Guide)
- A talk I gave at SRECon 2017 Americas
Encrypt all the things!
Mark Henderson
 Let’s talk about encryption. Specifically, HTTPS encryption. If you’ve been following any of the U.S. election debates, encryption is a topic that the politicians want to talk about – but not in the way that most of us would like. And it’s not just exclusive to the U.S. – the U.K. is proposing banning encrypted services, Australia is similar. If you’re really into it, you can get information about most countries cryptography laws.
But one thing is very clear – if your traffic is not encrypted, it’s almost certainly being watched and monitored by someone in a government somewhere – this is the well publicised reason behind governments opposing widespread encryption. The NSA’s PRISM program is the most well known, which is also contributed to by the British and Australian intelligence agencies.
Which is why when the EFF announced their Let’s Encrypt project (in conjunction with Mozilla, Cisco, Akamai and others), we thought it sounded like a great idea.
The premise is simple:
- Provide free encryption certificates
- Make renewing certificates and installing them on your systems easy
- Keep the certificates secure by installing them properly and issuing them best practices
- Be transparent. Issued and revoked certificates are publically auditable
- Be open. Make a platform and a standard that anyone can use and build on.
- Benefit the internet through cooperation – don’t let one body control access to the service
Let’s Encrypt explain this elegantly themselves:
The objective of Let’s Encrypt and the ACME protocol is to make it possible to set up an HTTPS server and have it automatically obtain a browser-trusted certificate, without any human intervention.
The process goes a bit like this:
- Get your web server up and running, as per normal, on HTTP.
- Install the appropriate Let’s Encrypt tool for your platform. Currently there is ACME protocol support for:
- Apache (Let’s Encrypt)
- Nginx (Let’s Encrypt — experimental)
- HAProxy (janeczku)
- IIS (ACMESharp)
- Run the tool. It will generate a Certificate Signing Request for your domain, submit it to Let’s Encrypt, and then give you options for validating the ownership of your domain. The easiest method of validating ownership is one that the tool can do automatically, which is creating a file with a pre-determined, random file name, that the Let’s Encrypt server can then validate
- The tool then receives the valid certificate from the Let’s Encrypt Certificate Authority and installs it onto your systems, and configures your web server to use the certificate
- You need to renew the certificate in fewer than 90 days – so you then need to set up a scheduled task (cron job for Linux, scheduled task for Windows) to execute the renewal command for your platform (see your tool’s documentation for this).
 And that’s it. No copy/pasting your CSR into poorly built web interfaces, or waiting for the email to confirm the certificate to come through, or hand-building PEM files with certificate chains. No faxing documents to numbers in foreign countries. No panicking at the last minute because you forgot to renew your certificate. Free, unencumbered, automatically renewed, SSL certificates for life.
Who Let’s Encrypt is for
- People running their own web servers.
- You could be small businesses running Windows SBS server
- You could be a startup offering a Software as a Service platform
- You could be a local hackerspace running a forum
- You could be a highschool student with a website about making clocks
- People with a registered, publically accessible domain name
- Let’s Encrypt requires some form of domain name validation, whether it be a file it can probe over HTTP to verify your ownership of the domain name, or creating a DNS record it can verify
- Certificate Authorities no longer issue certificates for “made-up” internal domain names or reserved IP addresses
Who Let’s Encrypt is not for
- Anyone on shared web hosting
- Let’s Encrypt requires the input of the server operator. If you are not running your own web server, then this isn’t for you.
- Anyone who wants to keep the existence of their certificates a secret
- Every certificate issued by Let’s Encrypt is publically auditable, which means that if you don’t want anyone to know that you have a server on a given domain, then don’t use Let’s Encrypt
- If you have sensitive server names (such as finance.corp.example.com), even though it’s firewalled, you might not want to use Let’s Encrypt
- Anyone who needs a wildcard certificate
- Let’s Encrypt does not issue wildcard certificates. They don’t need to – they offer unlimited certificates, and you can even specify multiple Subject Alternative Names on your certificate signing request
- However, you may still need a wildcard if:
- You have a lot of domains and can’t use SNI (I’m looking at you, Android 2.x, of which there is still a non-trivial number of users)
- You have systems that require a wildcard certificate (some unified communications systems do this)
- Anyone who needs a long-lived certificate
- Let’s Encrypt certificates are only valid for 90 days, and must be renewed prior to then. If you need a long-lived certificate, then Let’s Encrypt is not for you
- Anyone who wants Extended Validation
- Let’s Encrypt only validates that you have control over a given domain. It does not validate your identity or business or anything of that nature. As such you cannot get the green security bar that displays in the browser for places like banks or PayPal.
- Anyone who needs their certificate to be trusted by really old things
- If you have devices from 1997 that only trust 1997’s list of CA’s, then you’re going to have a bad time
- However, this is likely the least of your troubles
- Let’s Encrypt is trusted by:
- Android version 2.3.6 and above, released 2011-09-02
- FireFox version 2.0 and above, released 2006-10-24
- Internet Explorer on Windows Vista or above (For Windows XP, see this issue), released 2007-01-30
- Google Chrome on Windows Vista or above (For Windows XP, see this issue), released 2008-08-02
- Safari on OSX v4.0 or above (Mac OSX 10.4 or newer), released 2005-04-29
- Safari on iOS v3.1 or above, released 2010-02-02
However, these are mostly edge cases, and if you’re reading this blog post, then you will know if they apply to you or not.
So let’s get out there and encrypt!
The elephant in the room
“But hang on!”, I hear the eagle-eyed reader say. “Stack Overflow is not using SSL/TLS!” you say. And you would be partly correct.
We do offer SSL on all our main sites. Go ahead, try it:
However, we have some slightly more complicated issues at hand. For details about our issues, see the great blog post by Nick Craver. It’s from 2013 and we have fixed many of the issues that we were facing back then, but there is still some way to go.
However, all our signup and login pages however are delivered over HTTPS, and you can switch to HTTPS manually if you would prefer – for most sites.
Let’s get started
So how do you get started? If you have a debian-based Apache server, then grab the Let’s Encrypt tool and go!
If you’re on a different platform, then check the list of pre-build clients above, or take a look at a recent comparison of the most common *nix scripts.
Addendum: Michael Hampton pointed out to me that Fedora ships with the Let’s Encrypt package as a part of their distribution and is also in EPEL if you’re on RedHat, CentOS or another distribution that can make use of EPEL packages.
A Studied Approach at WiFi – Part 2
Peter Grace
Welcome back to my series on WiFi. In Part 1 of the series, I began with some basics of RF and explained some differences about antennas. It should be apparent at this point that there is a science behind this activity, and I’ll take this moment to warn you thoroughly before we move on: These posts are a good way for you to become familiar with WiFi and should provide you with some solid knowledge to help improve your WiFi coverage. However, this brief education is not a replacement for having an actual RF engineer do a site survey of your environment! If you have a “must work right the first time” environment, and you’re reading this because you’re the decision-maker and don’t have the slightest hint about what all this is about, Get An Expert. They do this all day long. It’s money well spent.
If you do use these techniques below, Your Mileage May Vary. It’s also important to note that if you go to all this work, setup your access points, then your neighbor goes and installs his AP right next to yours on the same channel, then you’re going to be stuck re-doing these activities all over again. WiFi isn’t a static situation; as people get more WiFi-connected devices, the playing field changes, and it will change on you, I guarantee it.
Understanding RF Interference and What It Does to WiFi
You hear people joke about microwave ovens interfering with WiFi equipment pretty often. Most people laugh it off as an urban legend. It’s not. Below, I have included some RF spectrograms for your entertainment. If you haven’t seen images like this before, they are a visualization of signal frequency and intensity over time. Past-to-present is a top-to-bottom relationship, and the colors are a heatmap (with red being a strong signal.) As you look at both types of graphs, the channels start from 1 at the left hand side of the graph, and go up through 12 in the right hand side. NOTE: Quick Shout-Out to the guys at metageek.net for creating the awesome Wi-Spy and accompanying Chanalyzer Pro software. We paid full price for the DBx bundle (Comes with the Wi-Spy DBx and Chanalyzer Pro) and I definitely feel like it was money well spent. Check them out if you want to do these types of visualizations yourself.

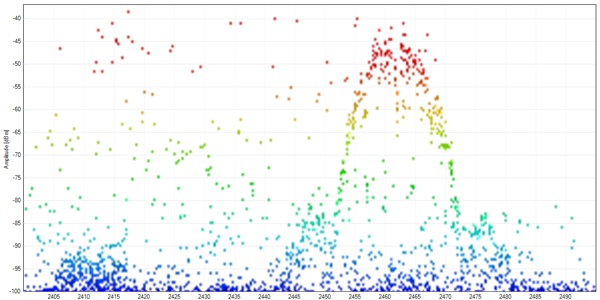
These images show what the wireless signal looks like in my suburban home. Not a lot of interference in this visualization, you can see my home Cisco Aironet 1240 AP humming along happily as visualized by the wavy lines in the waterfall spectrogram, above. In the lower graph, we see signal strength (Amplitude) measured by frequency.
Let’s shake things up, and show what happens when you fire up a microwave oven:

Look out, here comes that microwave burrito exploding all over your RF Spectrum! For about 30 seconds, I nuked a mug of water and this was the result. You can see through the swamp of RF that the access point does its best to compensate for the signal interference, but that’s a pretty strong blast of RFI.
Do you have a baby monitor at home? Is it on 2.4ghz? Ready to see what it’s doing to your wireless signal?

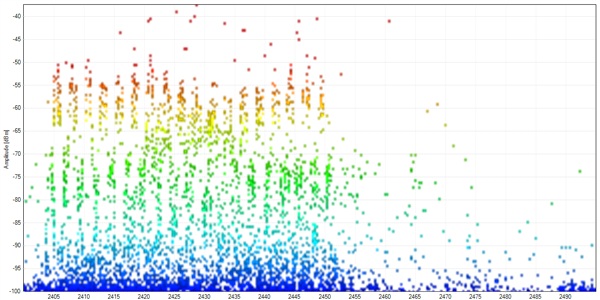
These two charts were captures I took from my friend’s house (incidentally, the gentleman who I mentioned in the previous post — he has a penchant for wifi problems.) I was over his house and ran some traces to get a visualization of his wireless conditions in preparation for installing a new wireless router. I asked him if he noticed the WiFi being slower at night and he’d mentioned that it did indeed seem to be more problematic at night. Welcome to the wonderful world of random equipment in your home causing issues with your wifi. In the above trace, you can see the telltale wavy lines of the access point, trying to power its way through the interference. The graph below has just the slighest hint of bell curve, which is where his AP was situated in the RF Spectrum. I believe in this case his AP was on channel 3. Needless to say, we popped his new wifi router on channel 11, which is quiet in these graphs.
One final graph to show. If you scroll back up to the initial image I showed of my suburban home, this will give you an idea of what your general household’s 2.4gHz spectrum might look like. Now, compare that image to this:
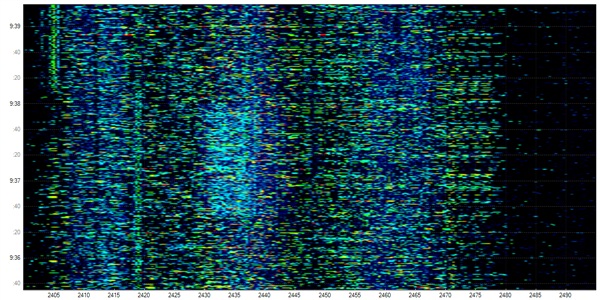

This, my friends, is what the 2.4gHz spectrum looks from the Stack Exchange offices. We’re located down by Wall Street, on the 26th Floor of One Exchange Plaza. Our scenic vantage point does come with a cost! These spectrograms show just how much RF interference we are subject to at this location. Astute readers may notice the timescale difference on the graphic, but I assure you that the 30 second view is just as nasty.
What can we take away from these charts? One could safely summarize this entire section as “Location and the gadgets in your home both play a significant role in how your WiFi might perform.”
Mapping Your Wireless Landscape
It’s worth noting that even though the above charts were taken using a very expensive measuring tool, your laptop’s WiFi card is a potent ally in your quest to improve your coverage. For the next section, I am assuming that you firstly are running Windows and have downloaded and installed both Vistumbler as well as Microsoft SQL express. I am aware that a strong number of our readership are Linux based, and there is also a big Mac contingent. I’ll unabashedly say that the steps I’m following and the software choices I made were purely for my convenience, but I hope that I explain the process in easy enough terms so that the tinkerers out there can take the wheat from the chaff, so to speak.
Step 1 – Take some measurements!
Vistumbler is a wardriving utility that, when attached to a gps, can help you map where there are wireless access points in range of your device. We’re going to borrow it for a more sedentary purpose. Fire up Vistumbler, set your laptop in the areas where you want to consume your WiFi signal, and then start the scan/capture process. Leave the laptop there for at least 30-60 minutes, as we want a whole lot of datapoints to work with. It will keep track of every time it hears of an access point and record the relative strength of the signal. Once the time is up, you can either run the detailed export to CSV now, or “Exit (Save DB)” and come back to export the file later. NOTE: If you’re in a tight urban region like we are at Stack Exchange, leaving Vistumbler up for 30+ minutes will result in a tremendous amount of data! It’s wise to have a very powerful PC to handle the vistumbler export process, or do seperate scans and aggregate the data together in a later step.
Step 2 – Massage the data!
Sadly, Vistumbler’s export to CSV does leave a bit to be desired with its field quoting. We’re going to open the csv in Excel, since it seems to be especially forgiving. Once we’ve opened it in Excel, we’ll do the following steps:
- Make a new column for Location. Populate the column with a location name. You’ll want this when you’re querying SQL later on.
- Save the file as an Excel spreadsheet.
- Fire up SQL Server Management Studio.
- Create a new database if you don’t already have a good scratch database, then right-click the db and select tasks->import data.
- Using “Microsoft Excel” as a datasource, submit your new excel file as the source data. HINT: If you’re getting an error about unable to find a particular OLE provider, and you’re on 2010 like me, with 64bit windows, you will likely need this link to load said provider.
- Select the destination database; elementary stuff here. From this point on, “Just Keep Hitting Next,” except for the prompt where you specify the destination table name. I strongly advise you to change that name to something easier to type rather than the default date/time string. Finally, Finish to start the import job. This may take a while, so don’t be afraid if it seems like it’s taking too long.
- Repeat these steps for each file of data. Be sure to specify the same table name for each import, it will append to the database.
Step 3 – Analyze!
With this complete, congratulations! You now have data in a sql server that you can use to leverage the power of SQL to get some statistics from. I’ll admit I’m a SQL neophyte — I can do some joins and “GROUP BY”s but I’m sure others could tease a lot more information out of it than I have. Here are some basic queries for your dataporn pleasure:
Get a sorted list of strongest access points across all locations:
select LOCATION, SSID, AVG(SIGNAL) AS AVGSIGNAL
FROM [dbo].[wifilog]
GROUP BY LOCATION,SSID
ORDER BY AVGSIGNAL DESC
| LOCATION | SSID | AVGSIGNAL |
| sysadmin | SO-GUEST | 90 |
| cantremember | SO-GUEST | 89.7431436154527 |
| cantremember | NULL | 73.9324583394779 |
| cantremember | ROVIO | 70.6069006192864 |
| sysadmin | ROVIO | 69.875 |
| sysadmin | NULL | 61.5 |
| sysadmin | hpsetup | 61 |
| cantremember | Grusslife | 60.2857564140372 |
| sysadmin | Grusslife | 59.5625 |
| cantremember | HPC7B114 | 55.2590909090909 |
In the above query, we see that in our sysadmin office, as well as somewhere in our office (for shame, I forget where I took the trace!) the strongest signals are SO-GUEST (our current guest wireless AP) and ROVIO (for our cute little mobile webcam.) We’ve also got a couple shadow AP’s (as specified by NULL) followed up by some other AP’s that I’m not sure who or where they are. Suffice to say, our current AP is pretty strong in these two locations.
Find the average signal strength of all APs at a particular location:
select SSID, AVG(SIGNAL) AS AVGSIGNAL
FROM [dbo].[wifilog]
WHERE LOCATION='sysadmin'
GROUP BY SSID
ORDER BY AVGSIGNAL DESC
| SSID | AVGSIGNAL |
| SO-GUEST | 90 |
| ROVIO | 69.875 |
| NULL | 61.5 |
| hpsetup | 61 |
| Grusslife | 59.5625 |
| Akin Law | 55 |
Similar to the first query, you can drill down by a particular location and see the top AP’s seen at that location. This is useful, but what we’re really looking for is the least used channels at a certain location.
Get a channel utilization chart
select LOCATION,CHANNEL,SSID,AVG(SIGNAL) AS AVGSIGNAL
FROM [dbo].[wifilog]
GROUP BY LOCATION,CHANNEL,SSID
ORDER BY AVGSIGNAL DESC
| LOCATION | CHANNEL | SSID | AVGSIGNAL |
| cantremember | 8 | NULL | 90.034808259587 |
| sysadmin | 8 | SO-GUEST | 90 |
| cantremember | 8 | SO-GUEST | 89.7431436154527 |
| sysadmin | 8 | NULL | 88 |
| cantremember | 11 | ROVIO | 70.6069006192864 |
| sysadmin | 11 | ROVIO | 69.875 |
| sysadmin | 6 | hpsetup | 61 |
| cantremember | 11 | Grusslife | 60.2857564140372 |
| sysadmin | 11 | Grusslife | 59.5625 |
The above gives us some pretty useful information. We can see here that channels 8 and 11 have several entries, and only one device in range of our scans is on channel 6. Using some critical thinking, it’d indicate that channel 3 might be a good choice should we want to add a new AP to this environment. Lets massage the query a bit to see if that’s confirmed by our other data:
select LOCATION,CHANNEL,SSID,AVG(SIGNAL) AS AVGSIGNAL
FROM [dbo].[wifilog]
WHERE CHANNEL in (1,2,3,4,5,6)
GROUP BY LOCATION,CHANNEL,SSID
ORDER BY AVGSIGNAL DESC
| LOCATION | CHANNEL | SSID | AVGSIGNAL |
| sysadmin | 6 | hpsetup | 61 |
| cantremember | 2 | NULL | 57.8348569743439 |
| sysadmin | 1 | cisco-voice-axiomSL | 55 |
| sysadmin | 6 | Akin Law | 55 |
| sysadmin | 1 | cisco-data-axiomSL | 55 |
| cantremember | 6 | Akin Law | 54.2220583898555 |
| cantremember | 2 | BLUESKY-NYC | 51.3716814159292 |
| sysadmin | 2 | BLUESKY-NYC | 51 |
| sysadmin | 1 | cisco-scan-axiomSL | 51 |
| cantremember | 6 | OpenWrt | 50.7345132743363 |
| sysadmin | 6 | OpenWrt | 50 |
| cantremember | 6 | EPAD | 49.154272517321 |
| cantremember | 1 | FGAwireless | 48.0518896220756 |
| sysadmin | 6 | EPAD | 48 |
| cantremember | 1 | cisco-voice-axiomSL | 47.982855143457 |
| cantremember | 1 | cisco-scan-axiomSL | 47.9389792899408 |
| cantremember | 1 | cisco-data-axiomSL | 47.4301110385369 |
| sysadmin | 6 | VX7E7 | 46 |
| cantremember | 4 | Corner | 45.3483043079743 |
At first blush, one might be enthusiastic about channel 3 given the fact it’s not used as the main carrier frequency in any of our entries. Be careful, though, for WiFi channels have some pretty strong overlap:
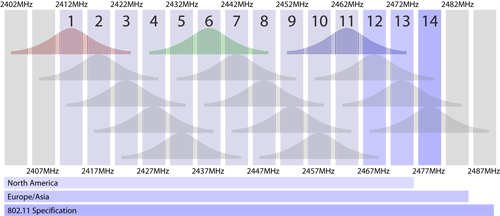
As this graphic shows, each wifi “Channel” is merely just a 5MHz swatch of the 2.4ghz ISM band. WiFi signals have a 22Mhz bandwidth, so realistically there’s only 3 channels one can use in an environment without any fear of interference or overlap. Because of this, one needs to take into account not only the channel but also the signal strength of potentially interfering access points.
In our case at Stack Exchange, there are just so many APs utilizing so many channels that we’ve ultimately decided to go with a Cisco controller-based access point layout, which will dynamically change channels based on signal conditions in realtime. For those of us at home, this is way too expensive of an option for most. Sadly, we’ll just have to take these data queries and give it our best shot.
I hope this blog series helps you a bit with your next WiFi installation. In summary:
- Antenna choice matters when you’re trying to cut through interference or travel long distances.
- Most residential building materials will not diffuse wireless signals to an appreciable amount unless you’re talking about very far distances, (i.e. trying to use your laptop on the third floor at the far side of your house when the AP is in the basement, for instance.)
- Be aware of electronics in your home that might share the 2.4GHz radio spectrum; they can seriously affect your wireless transfer rate and signal strength.
- Apps like Vistumbler can catalog used channels in your environment and you can then use this data to find a quiet spot in the spectrum.
As always, I welcome your comments and criticisms, below. Also, feel free to share any specific SQL queries you used that might help glean even more information from the datasets you’ve gathered!
A Studied Approach at WiFi – Part 1
Peter Grace
It has been my experience that many people simply buy a wireless access point, plop it down squarely next to their home cable/dsl modem, and assume that’s all they have to do to maximize their WiFi experience. Oh, were it to be so simple! I’d like to take a few minutes of your time today to cover some of the basics of what WiFi is, what it is and is not capable of, and how you as a SysAdmin or a home user can do a bit of detective work to help ensure your WiFi experience is less prone to issue.
RF Basics
Let’s take a moment and talk about Radio-Frequency Radiation. RF is a form of non-ionizing radiation where waves of energy radiate from a source and follow a predictable pattern based on the transmitter power and antenna. Radio waves are measured based on the size of the wave, and how frequently the wave oscillates. The frequency is measured in Hertz (Hz), or cycles per second.

Wavelength is the distance the radiation travels before it completes a single cycle. As we are mentioning travelling, we need to know the speed, right? This, my friends, is the speed of light.
C = f * λ , which translates to:
Speed of Light = Frequency * Wavelength
OR, if you're lazy, 300/Frequency in megahertz.
Light travels approximately 300 million meters per second, we can drop a whole bunch of zeros from the equation and still be reasonably accurate.
WiFi signals operate on 2.4 gHz (2.4 billion cycles per second), and that means that one full wave travels around 12-13 centimeters before the waveform returns to its starting position relative to the axis in the graph. 802.11a and 802.11n operate on the 5gHz range, which would put the signal wavelength at 6 centimeters.
OK, but, why should I care about this when all I want to do is surf porn and play online games? The answer lies in the fact that if your antenna is not properly suited for these measurements, it won’t work that well. The antennas you get from your access point vendor are “suitable” but far from ideal.
Not many people realize it, but there is an aftermarket for antennas for access points. When people/companies buy commercial grade access points, they usually don’t include any antennas, as it’s assumed you’re going to get the proper antenna for your application.
So, what types of antennas are there and what are the differences?
Omnidirectional – These are the antennas that people are most familiar with. They will usually be oriented vertically, and radiate their signal on the horizontal plane in all 360 degrees. See below radiation chart which does a good job of visualizing how the energy travels out of a veritcal omni antenna.

Directional/Yagi – Directional antennas are designed to send a signal straight to a specific spot with pinpoint accuracy. If you’re trying to setup a WiFi link between your house and a neighbor down the street, you’d need a directional antenna. The Pringles Cantenna is an example of a homemade directional antenna. Commercial antennas more closely resemble old TV antennas that everyone seemed to have on their house back in the 20th century. The below radiation pattern does look a bit weird, but understand that the directional beam is designed to be highly selective of signals based on its relative orientation versus the target signal. This allows a directional antenna to receive and send to stations much further away than an omnidirectional antenna, which sends RF energy in all directions.

patch – Patch antennas are normally flat antennas that are designed to radiate in a forward direction extremely well, with the signal attenuating sharply at the periphery. The radiation pattern below does have some similarities to the directional/yagi radiation pattern, but its lobe is more rounded in the forward direction. The patch antenna type is a good choice when you want to direct most of your energy in a particular direction but don’t necessarily want the pinpoint accuracy of a yagi.
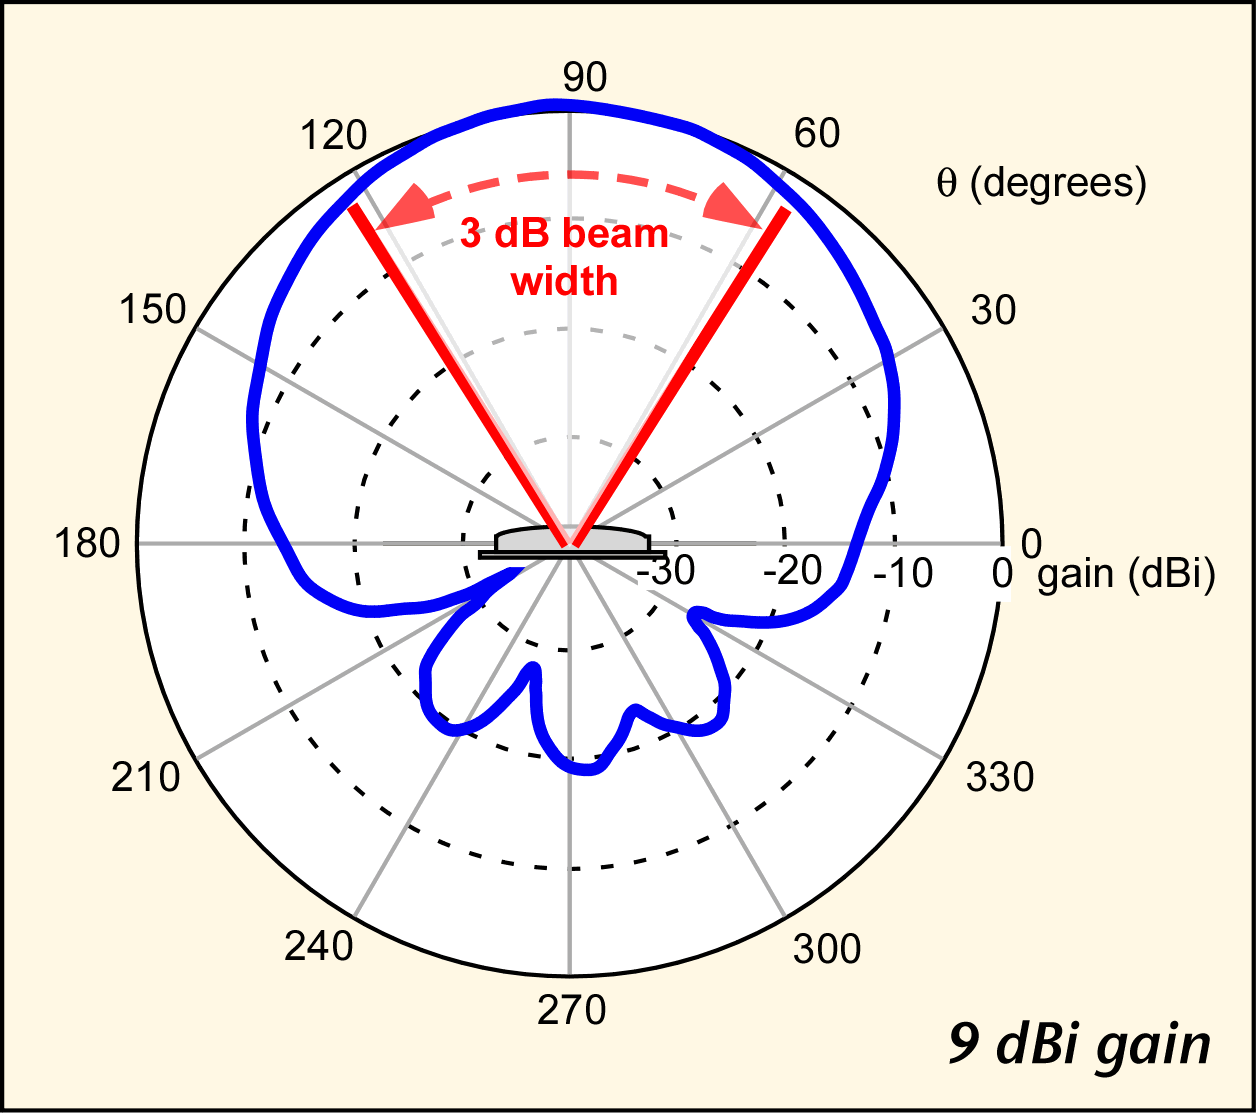
What blocks WiFi?
WiFi, operating in the 2.4ghz and 5ghz ranges, propogates in “line of sight.” Due to the short wavelength, the energy dissipates quicker if it is not channeled into a high-gain directional antenna. Consumer grade access points come with omnidirectional rubber duck antennas, which people usually orient vertically. If you look at the above radiation pattern, you’ll see that there is a void of energy directly above omnidirectional antennas when they are oriented horizontally.
All matter will attenuate RF energy to some extent as it passes along. The question on many people’s minds is what are the worst places you can install a wireless router or access point? Believe it or not, most materials in the home are not capable of attenuating your WiFi signal to a noticeable degree. In order for WiFi signals to be blocked effectively, they need to move through several layers of dense material in order to shed the energy required to become unusable. Some antenna manufacturers will quote how well the radio waves will propogate from a given antenna, as shown here for one of Cisco’s branded antennas:
The density of the materials used in a building’s construction determines the number of walls the signal must pass through and still maintain adequate coverage. Consider the following before choosing the location to install your antenna:
- Paper and vinyl walls have very little affect on signal penetration.
- Solid and pre-cast concrete walls limit signal penetration to one or two walls without degrading coverage.
- Concrete and wood block walls limit signal penetration to three or four walls.
- A signal can penetrate five or six walls constructed of drywall or wood.
- A thick metal wall causes signals to reflect off, causing poor penetration.
- A wire mesh spaced between 1 and 1 1/2 in. (2.5 and 3.8 cm) acts as a harmonic reflector that blocks a 2.4-Ghz radio signal. (NOTE: as a commenter below further explains, this type of mesh is common in plaster walls from the 1940s as well as in stucco applications.)
I once ran into an issue with a friend who had his wireless router installed in the basement, next to his cablemodem. He was having sporadic connectivity issues in a second floor room and asked me to come help diagnose. Sure enough, his room was directly above the wireless router, two residential floors below, and given that traverse and the location of his room in relation to the radiation pattern, there wasn’t enough RF energy propogating up into that location. The short-term answer for the problem was to orient his access point antennas horizontally, so that the radiation pattern is then set on its side, covering a wider swath of his house.
In a blog post to come, I will show you some methods you can use to help properly locate your access point and also help you decide which frequency your access point should operate on. Stay tuned, and as always your comments,criticisms and suggestions are always welcome!
Per Second Measurements Don’t Cut It
Kyle Brandt
Transfer rates and the number of packets you send are measured in units of a certain quantity of data per units of time. The unit of time that everyone is used to is the second. The standard quantity of data that is used in the networking field is bits and the standard time unit is seconds. So for example, the standard network interface these days is 1 Gigabit per second. So the quantity of data is a Gigabit, and the unit of time is a second. We call this the transfer rate. The key thing to remember is that this is a fixed ratio of data over time. Because of this, you can divide the ratio by any number you want to (Ignoring the complexities of the discrete properties of Ethernet frequencies, system clocking, etc). So, 500 Mbit over a half second is the same fixed ratio as 1 Gigabit per second.
The thing is though, in computing, a second is a really, really, really long time. This is important, because when we choose what unit of time to express this in, what we are doing is graph smoothing (It is sort of, although not really, like taking an average).
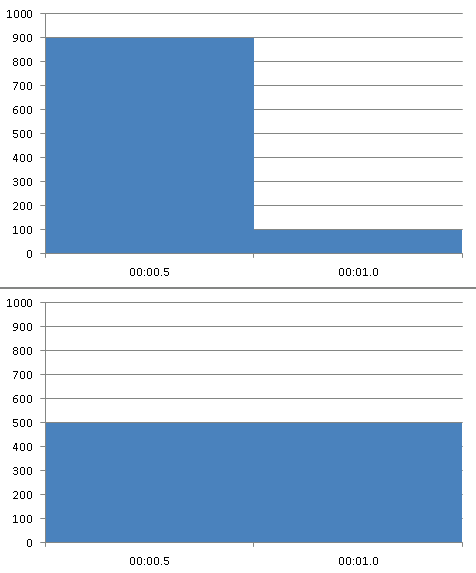
For example, we could transfer 900 Mbit in half of a second and another 100 Mbit for the other half of that second. How much data was transferred during that second? The answer is 1 Gbit. If we transfer 500 Mbit per half second and another 500 Mbit per the other half second — this is also 1 Gbit per second:. This effect is illustrated in these Megabits per half second graphs:
These two are clearly not the same thing, but when you express them as the amount of data transfered over a second they are. This is important because a 1 Gbit per second interface is also a 500 Mbit per half second interface — and a 500 Mbit per half second interface can’t transfer 900 Mbits per half second (I am ignoring any buffering effects, but in practice we have found this to be essentially true).
This effect is made even worse by most monitoring tools because most take samples every 5 minutes. So what you are really seeing is the transfer rate per 5 minutes converted to a per second rate. This sort of thing is why people say data can lie.
Why Should you Care?
We discovered that we were discarding packets pretty frequently on 1 Gbit/s interfaces at rates of only 10-30 MBit/s which hurts our performance. This is because that 10-30 MBit/s rate is really the number of bits transfered per 5 minutes converted to a one second rate. When we dug in closer with Wireshark and used one millisecond IO graphing, we saw we would frequently burst the 1 Mbit per millisecond rate of the so called 1 Gbit/s interfaces.
We have bonded these interfaces using Intel Load Balancing (ALB/RLB) and for the most part our discards have gone away. We did this on all but one of our web servers for a while and found that the one that didn’t have the bonded interface had discards climbing while the others did not.
A second is a long time — be wary of trusting it too much to measure things.
Have You Tried Turning it Off and On Again?
Kyle Brandt
When you have an infrastructure problem, rebooting the machine(s) is something you should do as a last resort. The reason is that you likely will never learn what the problem was, and it is probably going to come up again. I generally deplore this sort of troubleshooting and wrote about that opinion in my previous “Push the Green Button Twice” post. That being said, this is what we resorted to this past Friday for our entire switching infrastructure. This brought us offline for several minutes.
It all started on a Rainy Evening this Past Wednesday…
On Wednesday evening of this past week we started to see network timeouts in our application logs. Digging into this further and checking more logs this seemed to be widespread. On our Linux routers which run carp on the LAN side we saw some flapping going on. On our load balancers, we saw messages about late heartbeat messages. We use failover Intel teaming on our web server NICs and saw errors about missing probes. The problem was wide spread enough that it seemed to be the switching infrastructure, however there were no significant errors in the switch logs. We did see some ASIC and interface drops, but the incrementing of these did not seem to always coincide with major network blips in our infrastructure.
We then tried to localize the problem. We took network captures, and lots of them. Some from SPAN ports covering all of our traffic. Some from examples between select servers from the viewpoint of both servers as well as the viewpoint of the switch ports they were attached to. In addition to this we did iperf tests and ping tests between all sorts of different points in our network. We did broadcast analysis, tcp analysis, latency analysis, and IO graphing. Several of us worked pretty much around the clock for three days trying to figure this out. Although from the outside we were pretty much up, users were seeing timeouts. We even brought Cisco support into the mix and went through 3 support techs.
After three days of this, we honestly didn’t know a whole lot more than we did when we started — we were losing packets. We thought a lot about what we changed when this all started to happen and couldn’t think of anything. About two weeks ago we changed our switch configuration to a stacked setup using flexstack. Although a major change, it was two weeks ago. When we start to go down this road we are just starting to guess. Unless you actually see evidence that points to something, you really could say it is just about anything. The switch stacking is more related to what is going on, but there have been more recent changes — like the fact that it was raining — perhaps it was the rain?
When the jokes about what might be causing the problem become just as frequent as reasonable theories, that is probably the time to just try turning it off and on again — and that is what we did. It seems to have fixed the problem, but the weekend is our low traffic point and it could just seem fine because of that. This could also be some sort time based bug or something that is only triggered under a certain conditions.
Our Best Current Theory
Although traffic on most of our interfaces is quite low, lower than 100Mbit/s on Gigabit ports, it occured to me that maybe we were saturating more small scale units of time. I posted a question about this on Server Fault. The basic idea is that 1GBit per second is also 1Mbit per millisecond, and we are spiking the one millisecond limt frequently. If that is a realistic limit, our captures confirm that we do hit a lot. Perhaps enough of these spikes punishes the switches enough to trigger an unknown IOS bug?
This is still just a guess, but it is at least a plausible theory. So the solution we are going implement is a network architecture change I had planned on if we ever approached the 1 GBit/s bottleneck. We are going to set up a dedicated VLAN between our web servers and database servers that uses dedicated NIC ports. This dedicated path also won’t traverse the router making sure there isn’t a gateway bottleneck. The database traffic from the web tier will have its own dedicated interfaces that don’t have to share the path with our redis caching traffic and http traffic. Lastly we will bond these with an active-active method that will give us more throughput.
We don’t know if this will help prevent this problem or not, but we all think it is a better architecture so either way it is an optimization worth doing.
A Lesson in Troubleshooting Complex Problems — Document As You Go
The biggest mistake we made in this process so far in my opinion was not documenting our troubleshooting while we are doing it. By the time we got to Friday, we had a lot of data points. There were enough that we had trouble keeping them all in our head. That made it hard to make sense of them and our thoughts would go in circles at times. Even worse, we questioned if what we remembered and if our tests were even accurate.
Going forward I think we should use a collaborative document system like Google Docs to document our troubleshooting and any ideas we have as we go. Each test we do should include:
- When the test was run in UTC time and who ran it
- Screenshot(s) of the test. This is very important so people can verify the results, and repeat the test.
- Attachments and/or links to where the file is of logs and things like capture. Captures should include screen shots of graphs and analysis as well.
- Whatever conclusions you think can draw at the time from the testing as it relates to the problem.
With this on day two we can look at what we have done so far and what the sum of it all what logically might mean. Also, when people are taking breaks or are away, when they come back they can get caught up on what is happening. In the long run it will save time and make the troubleshooting more effective. We can still use an open phone line to communicate, but this would record the most important tests and ideas.
I really hope we stay calm enough and have the discipline to do this text time we deal with a major problem.
Windows 2008 and broken ARP
George Beech
A couple of weeks ago we had one of our edge routers go down on us. Nothing bad happened, failover to our secondary router work just as expected. Now, we saw something wierd this week when we looked at the internal interface graph for our secondary router.
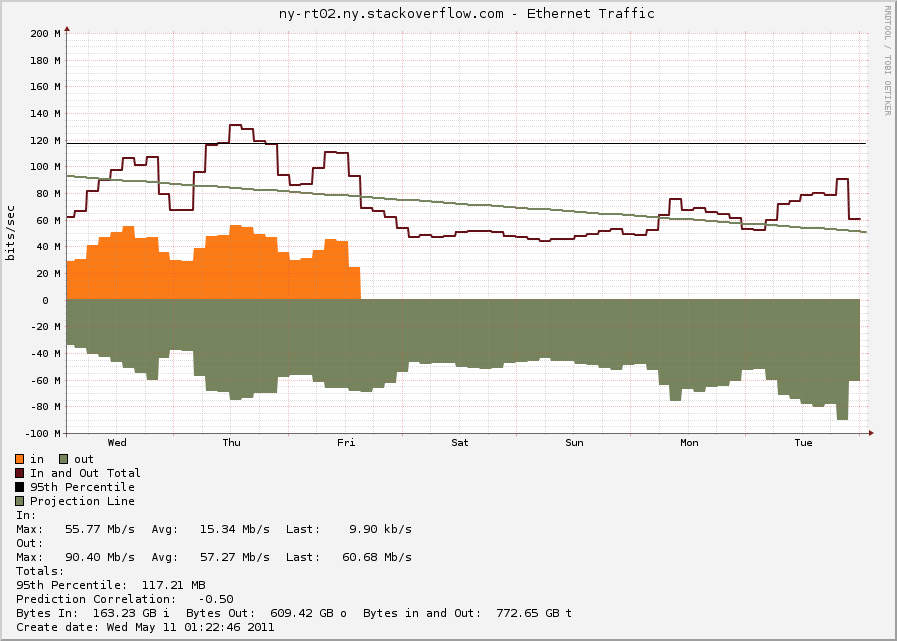
I’ll give you a second to try and see what we saw – although I don’t think you’ll need a whole second to see something very very strange going on with this router. That’s right, there is a whole lot of outbound traffic on this router, but ZERO inbound traffic. The next question we had was what could possibly be causing this? I really don’t think that I could be anything good.
You can clearly see on the graph where we failed back to our primary router. But, after that there is still a ton of traffic that is traversing our secondary router when there should be very little traffic going through there.
After some digging around we found that our Windows servers had the wrong ARP address for the VIP of our routers. That’s right, Windows still had the wrong ARP address after the fail back to the primary router, it even had the wrong ARP address days later.
How could this be possible? I was stumped after some digging around it seems that Microsoft changed the way that the network stack handles Gratuitous ARP packets (GARP packets) with Windows Vista/2008 RTM. This change has persisted through to Windows 7 and Windows 2008 R2.
What is Gratuitous ARP?
Gratuitous ARP is when a system sends out an ARP packets announcing to all system what it’s MAC address is. You generally see these in HA environments that make use of Virtual IPs that can move back and forth between machines. You will normally see a machine issue a GARP packet when a fail over event occurs and the new machine picks up the VIP. Wikipedia ARP article for more info on the ARP protocol
What did Microsoft Change?
There is actually very little information out there about windows and how it handles GARP. The best resource i’ve found that gives a very good overview of the new windows networking stack is a very well written technet blog. About 3/4 of the way down there is a section named “Changes to ARP cache updating” within this section lies the answer to all the mystery of our weird network bandwidth.
>First, a Windows Vista or Windows Server 2008 will not update the Neighbor cache if an ARP broadcast is received unless it is part of a broadcast ARP request for the receiver. What this means is that when a gratuitous ARP is sent on a network with Windows Vista and Widows Server 2008, these systems will not update their cache with incorrect information if there is an IP address conflict.
>Additionally, when a gratuitous ARP is sent by a Windows Vista or Windows Server 2008, the following change has been made – the SPA field in the initial request is set to 0.0.0.0. This way the ARP or neighbor caches of systems receiving this request are not updated. So, if there is a duplicate IP address, the receivers do not need to have their cache corrected.
The question is why is this such a big problem for Microsoft? Well the answer is they have hi-jacked the GARP packets for their Address Conflict Detection mechanism. You know that pop-up that says “Another machine on this network has been detected with the same IP address”. With previous version of windows they had the same mechanism, but still respected the normal GARP packets, thus there would sometimes be an issue with Windows systems updating their ARP cache with invalid data. They fixed it by breaking GARP.
Why is this a problem?
Beyond the issue we have seen with Windows 2008 not respecting GARP packets this can cause other wierd problems. One example I can think of off the top of my head, is that for HA systems that use GARP to facilitate moving the VIP when a system goes down is that you will now have to wait for the OS to timeout the neighbor cache. This will add more time to your fail over, possibly causing things that are expecting a quicker fail over to break.
Is there a Fix?
I have not been able to find a fix for this. Although there is very little information out there on Windows networking at that low of a level. If you know of a fix to this issue I’ve started a question on Server Fault.
A Network Administrator’s View:
When digging into some packet dumps to try to solve some issues I was seeing with our Broadcom network cards, something else caught my eye. When looking in Wireshark to see if there were TCP retransmits I didn’t see any in my capture but I did see a very large amount of TCP zero window messages between our web tier and our Database tier.
To follow this you need to be familiar with TCP flow control, so I will briefly cover this. Since TCP is full duplex, each side of the connection is both a sender and a receiver. However, you will often have one side doing more of one then the other. In this case with our sites it is the SQL server backend that plays the role of the sender and the web tier is the receiver. The reason for this is that the web tier just sends a database query which will be short, and the database server will send back the results of that query which will generally be larger than the query itself.
The rate of data transfer is controlled by the receiver telling the sender how much data it can receive. The amount of data that can be received is called the TCP Window. This window shrinks as the network buffers fill up. If the window fills up faster than the application retrieves the data from the network buffers then eventually the receiver will let the sender know that is can’t receive any more data for the time being. TCP informs the sender that it can’t receive more data by sending a TCP packet where the window size is zero — this is our zero window message. What this means in our case is that the sender (SQL server) is sending data to the receiver (the web servers) faster than they can process it.
So as a network administrator, if I don’t want to just blame the application, I look to what I can fix on the network side. One cause of this would be that if there is a lot a latency between the web tier and the database tier than the window might be too small. To check this the simplest way was to send pings up to the size of the MTU with the don’t fragment bit set and make them as rapid as possible. I did this but only saw peaks of 1-2 MS latency. Even if we take a view that the performance is worse than measured, the bandwidth delay product for this latency is ( (RWIN in Bytes)/(Latency) * 8 = (Max Throughput in Bits) ):
(65535/0.003) * 8 = 174,760,000
So this didn’t really seem to be the issue here since the bandwidth is lower than 174 mbit/s. Also, in Windows Server 2008 R2 there isn’t much you can do to enlarge the default window by using window scaling because Windows automatically controls this.
The other theory I had is that maybe somehow the network stack or network driver is not letting the application know that there is data to be retrieved fast enough. CPU usage is moderate so I figured that it was not a lack of processing power the web servers. The way the network stack will inform the application that there is data in the buffers is by sending an interrupt. Because at gigabit speeds interrupts can start to take up a lot of CPU power there are several tuning options for this. One option is to dedicate these interrupts to a certain core or group of cores. Another option that the NICs have to keep the interrupt CPU load low is interrupt moderation, this dampens the rate of interrupts by batching them. I tried tunning these various options to make the interrupts more frequent but I still saw a high rate of zero window messages.
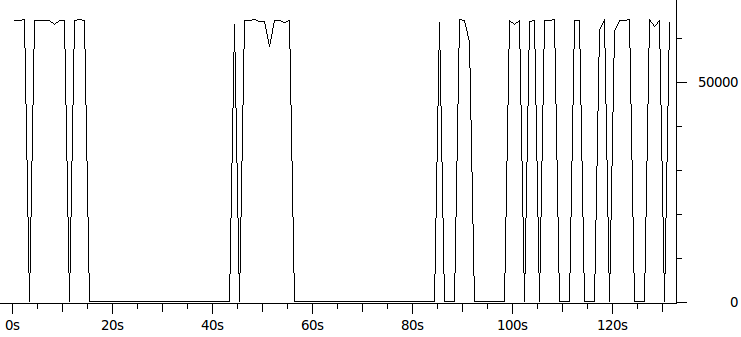
My skills as a network administrator pretty much hit a wall at this point and I didn’t get any network level answers on Server Fault that solved this issue for me. Next I turned to Stack Overflow to see if there was maybe a way to have .NET tell Windows to increase the size of the TCP window. My theory was that if the TCP window was bigger than it might stop bottoming out as it does in this graph of the average window size over time during my capture:
A Developer’s View:
When I asked about Speeding up the rate that IIS/.NET/LINQ retrieves data from the network buffers on Stack Overflow the pieces started to fall together with Remus’ answer. I wasn’t sure if what he was saying was the case, but I now had something to run with to try to get more information. With this information, I put on my admittedly somewhat shabby DBA hat.
A DBA’s View:
To verify that this might be the case I used the queries I had learned from Professional SQL Server 2008 Internals and Troubleshooting to view the SQL DMV of top wait times. One of the top wait times was async_network_io. This SQL server wait type means that SQL server has to wait because the client is not ready to receive all of the data it is sending. The problem with this DMV view is that it only shows total times since SQL server was restarted, and I needed to see which particular queries were causing the waits. So I turned to dba.stackexchange.com to try to find out how I could find the queries causing network waits safely in a production environment. The answers provided me with queries that I could run to take snapshots of queries. There were queries that frequently showed up with async_network_io wait times. I saw one query over and over again with 200-800MS of network wait. The query with “SELECT TOP 3000” and a whole wall of fields after it raised my eyebrows as that sounded like a lot of data to be sending back to the web server.
Not being that much of a DBA (at least, yet) this was about the end of the road for me. So I sent the top offenders I found to the developers and Brent Ozar.
Back to the Developer’s View:
Remus’ original answer had two theories for what might be going on:
- The client (web tier) was requesting more data than it should
- There was waiting going on while processing the data before fetching it all
The Top 3000 query was clearly more data than was probably needed and was a query constructed by LINQ. A large query in some ways make sense at first because the results of this query were aggressively cached. Also, for a while now our web tier has had CPU power to spare so moving processing to the web tier appears to be a good thing to do. However, returning large data sets to the web tier usually won’t work well, at least as part of a user request, due to the high network penalty.
The second theory is that a DataReader is being used to read the data one record at at time, and something is performed on each row before fetching the next record causing wait time between each query. I am not aware of any instances of this for our large queries yet. If there are such queries the solution might be to use a DataSet which would fetch all off the rows before processing them.
So the solution was to move the query to a background thread so it won’t slow down user response time, and of course make the query more limited in the amount of data it returns.
Back to the Network View, Meta is Murder:
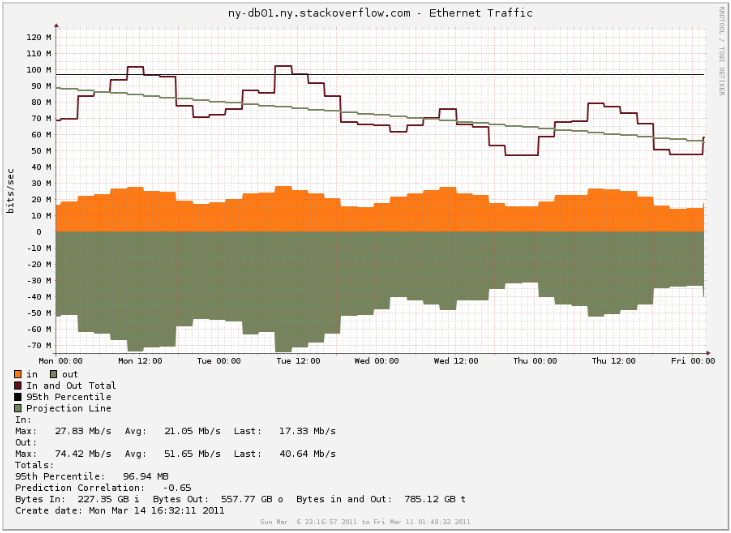
The most shocking thing is that after this query was adjusted the amount of data being sent from the database sever dropped about 20mbit/s (Notice the difference between Tuesday and Wednesday during peak hours):
So was this query really pulling this much data even though it isn’t running that frequently? The answer is both yes and no.
Since TCP/IP and Ethernet carries overhead for the headers part of the data going over the wire is just meta data added by the network. The minimal amount of TCP/IP and ethernet overhead is (See this page for more information):
(1500-40)/(38+1500) = 94.9285 % IPv4, minimal headers
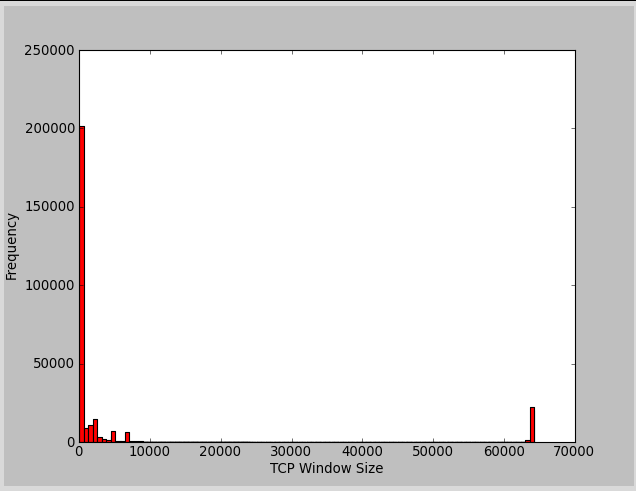
So at an optimal window TCP window size each packet will have the maximum amount of user data of 1460 bytes (without jumbo frames/vlan tagging/etc). The 78 bytes of overhead in this case is about 5% of overhead (78.00/1538.00). When our network is not hitting zero window messages the window sizes were often around 200 bytes. I made a histogram of my capture to show just how often it was in the range of small windows (resolution isn’t there to show it, but most of it is around 200):
The window size of a TCP packet will be the size of payload data minus 8 bytes since the window size is everything beyond the acknowledgement number in a TCP packet (I might be off on this calculation, I could not find a direct reference to verify this). So with a window size of 200 bytes we are sending 194 bytes of user data in a packet. So with this we have 70 bytes of overhead and 194 bytes of user data which is about 27% of overhead.
So when transferring about 100 mbit/s of user data you would only see about 5 mbit/s of extra data in the SNMP octets counters with a good window size, so from the SNMP view the transfer rate would be 105 mbit/s. When transferring 100 mbit/s of user data with a window size around 200 bytes there is 27% overhead and you end up with about 27 megabits a second of overhead for 127 mbit/s of traffic from the SNMP view. This ignores any overhead provided by the application level protocol that the web tier uses to speak to SQL server.
This pattern of window sizes is referred to as “Silly Window Syndrome” since the meta data can start to overtake the actual amount of user data being transfered. This overhead explains the large drop in database traffic beyond just reducing the amount of query data returned.
Lessons Learned
I think the biggest lesson is that the full view of many problems is missed unless each person in the team has at least some understanding of what is going on from other team members views. Also, the communication between different specialists is needed to solve many issues. In this case what looked initially to me like a networking problem was actually a symptom. Trying to attack the problem solely as a network administrator was treating the symptom, not the disease.
From a technical standpoint the difference between having the web tier and SQL servers on the same box compared to having a network connection between them is important. Things may work well on a single server, but when the data needs to be moved over the network shifting the load to web servers might not always work.
We still have a good amount of zero window packets going back and forth, so although the worse offenders have been mitigated I believe there is still might be work to do.
Broadcom, Die Mutha
Kyle Brandt
Until a year ago I never really thought much about NIC vendors. I figured if you bought Intel or Broadcom you were safe, maybe if I was doing near Gigabit speeds constantly or iSCSI I would have to pay more attention, but other than that I figured I was good.
Man, was I ever wrong.
Fail #1
This all started almost a year ago in our Oregon data center. In fact it was one the first things that was handed back to me when I started. On our web servers after upgrading to Windows Server 2008 R2 after about a week or two we would lose connectivity on a web server.  This was happening to all the web servers, just not at the same time. After losing connectivity when you went to reboot the server it wouldn’t. You had to wait about 10 minutes for the BSOD to come and then the server would reboot (More at Windows Server 2008 R2 network adapter stops working, requires hard reboot).
So we raised a case with Microsoft and after a month of back and forth and some kernel patches we still had the problem. So we tried some Intel NICs and the problem went away.
Fail #2:
Now in our NY data center (Dell hardware instead of IBM, but still Broadcom NICs) I saw some packets being lost and various network timeouts recently. So I updated the firmware on a test server and a couple days later updated the rest of our web servers. I saw no improvements so I started to dig deeper into some tcpdump data with Wireshark and I see the following sorts of ARP requests coming from the servers:
17:03:41.187682 ARP, Request who-has 89.145.83.164 (00:21:9b:a2:c9:be) tell 64.34.119.21, length 46
17:03:41.187684 ARP, Request who-has 74.125.91.109 (00:21:9b:a2:c9:be) tell 64.34.119.21, length 46
17:03:41.187686 ARP, Request who-has 64.34.80.179 (00:21:9b:a2:c9:be) tell 64.34.119.21, length 46
ARP is used to find the MAC address of servers within the same network. In fact it is at the foundation of the network stack that much of the Internet is built on. There should never be ARP requests for IPs outside of your network (More at Windows 2008 R2 Servers Sending Arp Requests for IPs outside Subnet). This disappeared when I disabled failover teaming and came back when I enabled it again.
Fail #3:
Now about every week I am getting corrupted arp tables. Deleting the table with arp -d usually results in the table not being rebuilt, or if it does it shortly fails again after. The solution is to reboot the server. So I called Dell and they can’t help me because it is a software issue. So now we are right back where we were with our NICs in Oregon.
Solution:
We are replacing our Broadcom NICs with Intel on our primary production boxes. We replaced one of the NICs with an Intel NIC a couple weeks ago and have not seen either of these problems in that server so we are going to do this with the rest of our servers.
I don’t ever want to touch a Broadcom NIC again. Intel is a company that makes more sense to me anyways as their engineers are more frequently part of what I think of as the fabric of the Internet. Last issue I had with an Intel product I posted on their free mailing list and got a response from an Intel engineer within hours. The best thing to do at this point I think is to take these Broadcoms out to the field:
